


Many companies draw the wrong conclusions from their customer surveys. There is a simple method that can provide a remedy, leading to better decisions.
Ansgar Lindner,1 Chief Marketing Officer of a trading concern operating internationally was at a loss to understand his predicament. His team seemed to be doing everything right. It regularly asked the customers about their satisfaction, worked out where there was a need for optimisation and concentrated hard on working to improve poor results. Yet whereas customer satisfaction rose, customer loyalty and turnover per customer were both stagnant.
Mistaken conclusions about moving from what is to what should be
Many other companies also go about things in the same way as Lindner’s team: the marketing departments analyse how satisfied customers are with various performance attributes, such as product quality, delivery speed and friendliness of the staff. They then set to work on improving those attributes that customers are not satisfied with.
However, in the process Lindner and many other managers forget to take into account how important these attributes are for achieving marketing targets such as customer loyalty and customer turnover. Of course, an important attribute has to be improved if it registers a poor level of satisfaction. Yet anybody investing heavily in an unimportant attribute with a low level of satisfaction is wasting money. That is a fact that can be intuitively grasped but is still often ignored: of 100 companies that we recently surveyed on this topic (see infobox above), it is indeed the case that 95 of them record customer satisfaction with individual performance attributes. Yet 87 of these 95 firms (92%) state that simply a low level of satisfaction taken on its own leads to efforts aimed at improvement.
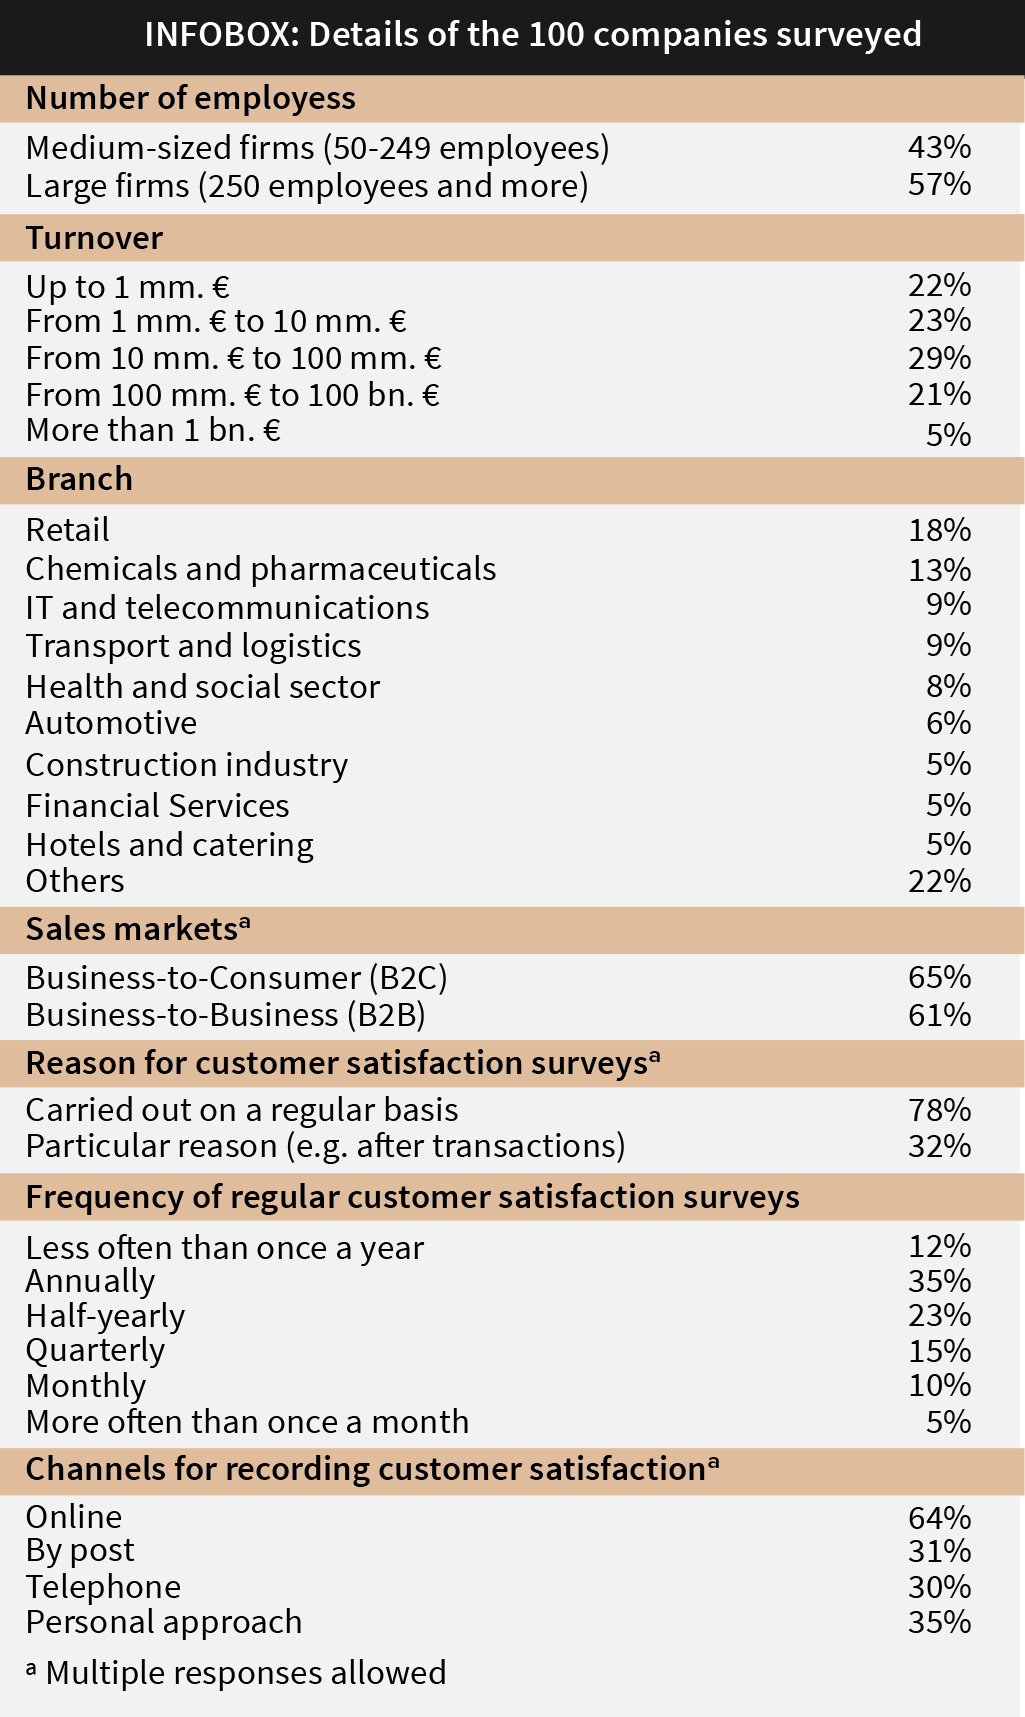
Matrix of customer satisfaction
In order to arrive at a meaningful evaluation of the results of customer satisfaction surveys they must be subdivided into two dimensions: into the level of the attributes – such as the average satisfaction or the Net Promoter Score – and the importance of the attributes. The lower the level and the higher the importance of an attribute, consequently the greater the need for action in the corresponding customer segment.
The two dimensions form a matrix (see figure 1 above) which enables simple conclusions to be drawn. Here what matters is not the absolute position of the attributes in the matrix – for example, whether they are in the “green” or the “red” section. The key issue is the position of the attributes in their relation to each other. The attribute situated lowest down to the southeast must be more urgently improved than the other attributes. As soon as this attribute has been improved and it is moving northwards in the next customer surveys, another attribute will be lying closest to the southeast corner and will be requiring attention. This interpretation of the matrix leads to a continuous improvement process in which we always turn our attention to the attributes with the most urgent need for action.
Determining the importance of a performance attribute
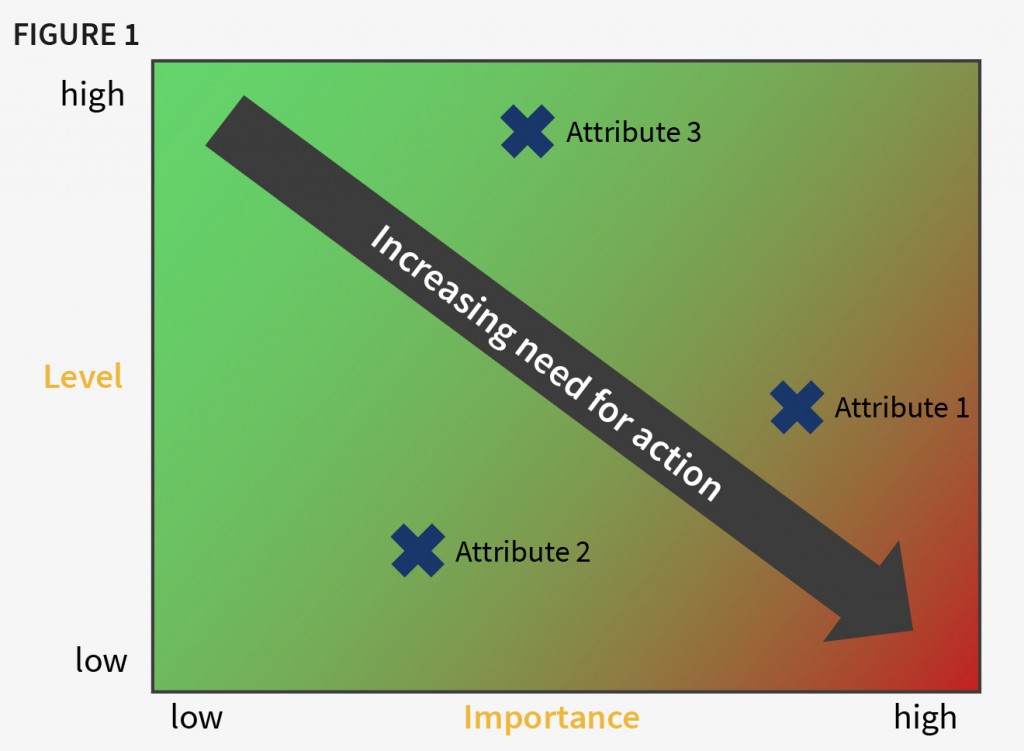
Business enterprises employ various means in order to ascertain the importance of an attribute. The path most often trodden, namely by 49%, consists of getting the customers to evaluate how important the performance attributes are for them. That is pragmatic but assessments by customers should be subjected to critical scrutiny. Firstly, customers tend to assess a great many factors as of great importance. This phenomenon, which might be termed “inflationary expectations” in marketing, makes it more difficult to prioritise the attributes. Secondly, the customer assessment can be subjective and seriously distorted and can send market researchers down the wrong path as to which attributes they should improve.
It is more astute to determine the importance statistically – best of all by a regression analysis. This analysis shows by how much a target variable (such as turnover, profitability, loyalty or total satisfaction) increases, if satisfaction with one attribute (such as product quality or delivery speed) rises by one unit. The higher the relevant value,2 the more important the attribute is – free from the subjective distortions of the customers.
Taking an example from the aviation industry, whenever asked directly what they consider important when flying, airline passengers place feeling safe in the number one spot.3 In contrast, a regression analysis which we recently carried out for 8,000 customers of two German airlines demonstrated that the feeling of being safe and secure only has very limited influence on total passenger satisfaction with the airline. The biggest influence is actually exerted by the friendliness of the cabin staff, seating comfort and the catering on board.
It is only at first sight that this discrepancy can come as a surprise. It goes without saying that subjectively air passengers think that the feeling of being safe is the most important because when we fly safety is the clearly last thing we would want to do without. Nevertheless, (in Germany at least) a greater feeling of safety has hardly any effect on increasing our loyalty to an airline. There are two reasons which could account for this: first of all, for many air passengers safety is a so-called “hygiene factor” – less safety reduces customer loyalty but more safety does not increase it. Secondly, passengers who feel unsafe often do not blame this on the airline but on other factors such as the weather and their own fear of flying.
This example illustrates that the subjective rating of importance by customers is not always of any assistance to market researchers. A regression analysis offers a better way but is only applied by 11% of the companies we surveyed.
Apart from customer assessments and regression analyses, use is also made of sector analyses (23%) and correlation analyses (22%) (see figure 2 above). Both are pragmatic approaches yet have serious disadvantages: in the case of sector analyses it is often questionable to what extent the way importance was determined is valid and how far the results can be applied to a particular company. In the case of correlation analyses, as a way of measuring importance, companies calculate the correlation coefficient between customer satisfaction with a performance attribute and a target variable. However, this is a dubious approach: a correlation coefficient does not indicate to what extent satisfaction with an attribute boosts a target variable but merely the extent to which this relationship is linear. That is to say, the correlation coefficient between attribute satisfaction and a target variable can be of the same size for both a very important and a very unimportant attribute.
Conclusion
In order to draw the right conclusions from customer surveys, we should give priority to improving those performance attributes which are important but were given a poor rating. We can determine the importance of the attributes by means of a regression analysis in which we explain the desired target variable (such as turnover per customer) through the customer grading of the attributes (such as product quality, speed of delivery).
Ansgar Lindner introduced the satisfaction matrix in his company and realised that for years his team had been investing in the improvement of attributes which tended to be of minor importance – such as in the layout of sales documents and sales seminars fostering personality development. Furthermore, it turned out that important attributes had previously not been investigated and therefore had not been prioritised, in particular processes in After Sales Service. Lindner’s team is now focussing on the most important attributes and is pursuing a continuous process of improvement.
About the Author
![]() Dr. Johannes Habel is a lecturer and programme director at ESMT. In his programme development, consulting, and teaching, he focuses on sales and marketing management.
Dr. Johannes Habel is a lecturer and programme director at ESMT. In his programme development, consulting, and teaching, he focuses on sales and marketing management.
References
1. Name changed
2. More precisely, the standardized regression coefficients serve as importance indicators. All commonly used statistics programs (for example SPSS) display these regression coefficients.
3. Source: BDL Verbraucherreport 2013.


")


![iStock-1438575049 (1) [Converted]](https://www.europeanbusinessreview.com/wp-content/uploads/2024/11/iStock-1438575049-1-Converted-100x70.jpg "“Does Everyone Hear Me OK?”: How to Lead Virtual Teams Effectively")


