


By Jacques Bughin
AI leaders are delivering extraordinary growth, but their stock prices may already assume an even more extraordinary future. So, is AI really a bubble?
For many, artificial intelligence already has many of the visual characteristics of a bubble. The largest 50 AI companies in the AI universe span accelerated computing, semiconductors, networking, cloud infrastructure, power, data, cybersecurity, and enterprise software, and include household brand companies such as Nvidia, Microsoft, Alphabet, Amazon, Meta, Broadcom, TSMC, AMD, Palantir, ServiceNow, Salesforce, or still CrowdStrike, Datadog, Snowflake, and Cloudflare. By now, those companies represent approximately $30 trillion of equity value.
A bubble can therefore exist even when the technology is real.
For perspective, the S&P 500 had a total capitalization of roughly $67 trillion around the same period. The comparison is not an index weight—the sample includes non-S&P companies and is economically selected—but it illustrates the scale of the AI complex. At the same time, the ten largest S&P 500 companies have recently represented close to 40% of index capitalization, a degree of concentration not seen for decades, and often seen just before bubbles (S&P Global, 2025, 2026). Furthermore, the Shiller Index (a measure of price-to-earnings), went from 35 in 2020, to a 48 to 54 range by Q2 2026 for the tp AI companies
If those are legitimate historical warning signals, they are not, by themselves, proof of a bubble. Greenwood, Shleifer, and You (2019) show that spectacular industry price run-ups increase the probability of a subsequent crash but do not mechanically imply that all such booms are irrational. Pástor and Veronesi (2006, 2009) show why technological revolutions can rationally produce bubble-like valuations: uncertainty creates option value before the underlying productivity is fully observable.
Still, the current AI cycle also differs from many speculative episodes in one crucial respect: many of the firms carrying the largest AI valuations already produce extraordinary growth, margins, and cash flows. Nvidia’s fiscal 2026 revenue grew 65%, and Q1 fiscal 2027 revenue grew 85% year on year. Palantir’s Q2 2026 revenue grew 93%, with U.S. commercial revenue up 149%. These are not pre-revenue stories. The average universe of the top 50 AI companies generates a very strong rule of 50 (top-line growth plus EBITDA margin), which is 20 points above the long term S&P and just below the Magnificent Seven, at 59, (outside Nvidia): Google/alphabet, Meta, Amazon, Apple, Microsoft, Tesla). Thus, real economics have been solid, making the thesis of a bubble likely overdone.
Reverse Engineering Implied Performance
Artificial intelligence thus creates a difficult valuation problem. Current earnings and cash flow may omit valuable future applications, yet prices can also capitalize commercialization paths that firms have not demonstrated. Technological revolutions create a valuation problem that conventional multiple analysis handles poorly. Pástor and Veronesi (2009) model a new technology whose productivity is highly uncertain before widespread adoption. The uncertainty itself creates a valuable option because the right tail of potential future outcomes is large. As information arrives and adoption spreads, uncertainty is resolved and part of the technological option becomes realized operating value.
The valuation is thus economically supported when realized cash flows arrive fast enough to replace the option that was already capitalized in the stock price. A bubble can therefore exist even when the technology is real. For AI this d is especially important because the technology can be successful at three levels while still disappointing shareholders: it can improve model capability, diffuse rapidly through firms, and generate large social productivity gains, while competition, capital intensity, or valuation compression prevents suppliers from capturing enough of that value.
To see how operating performance is needed to compensate for the option value in stock price, we therefore reverse-engineered the expected economic performance already embedded in today’s prices, and assess whether firms can plausibly deliver it.
The central question is not whether Red companies can reach Rule of 40—they already exceed it—but whether a Rule-of-50 company can become a sustained Rule-of-70 company performance.
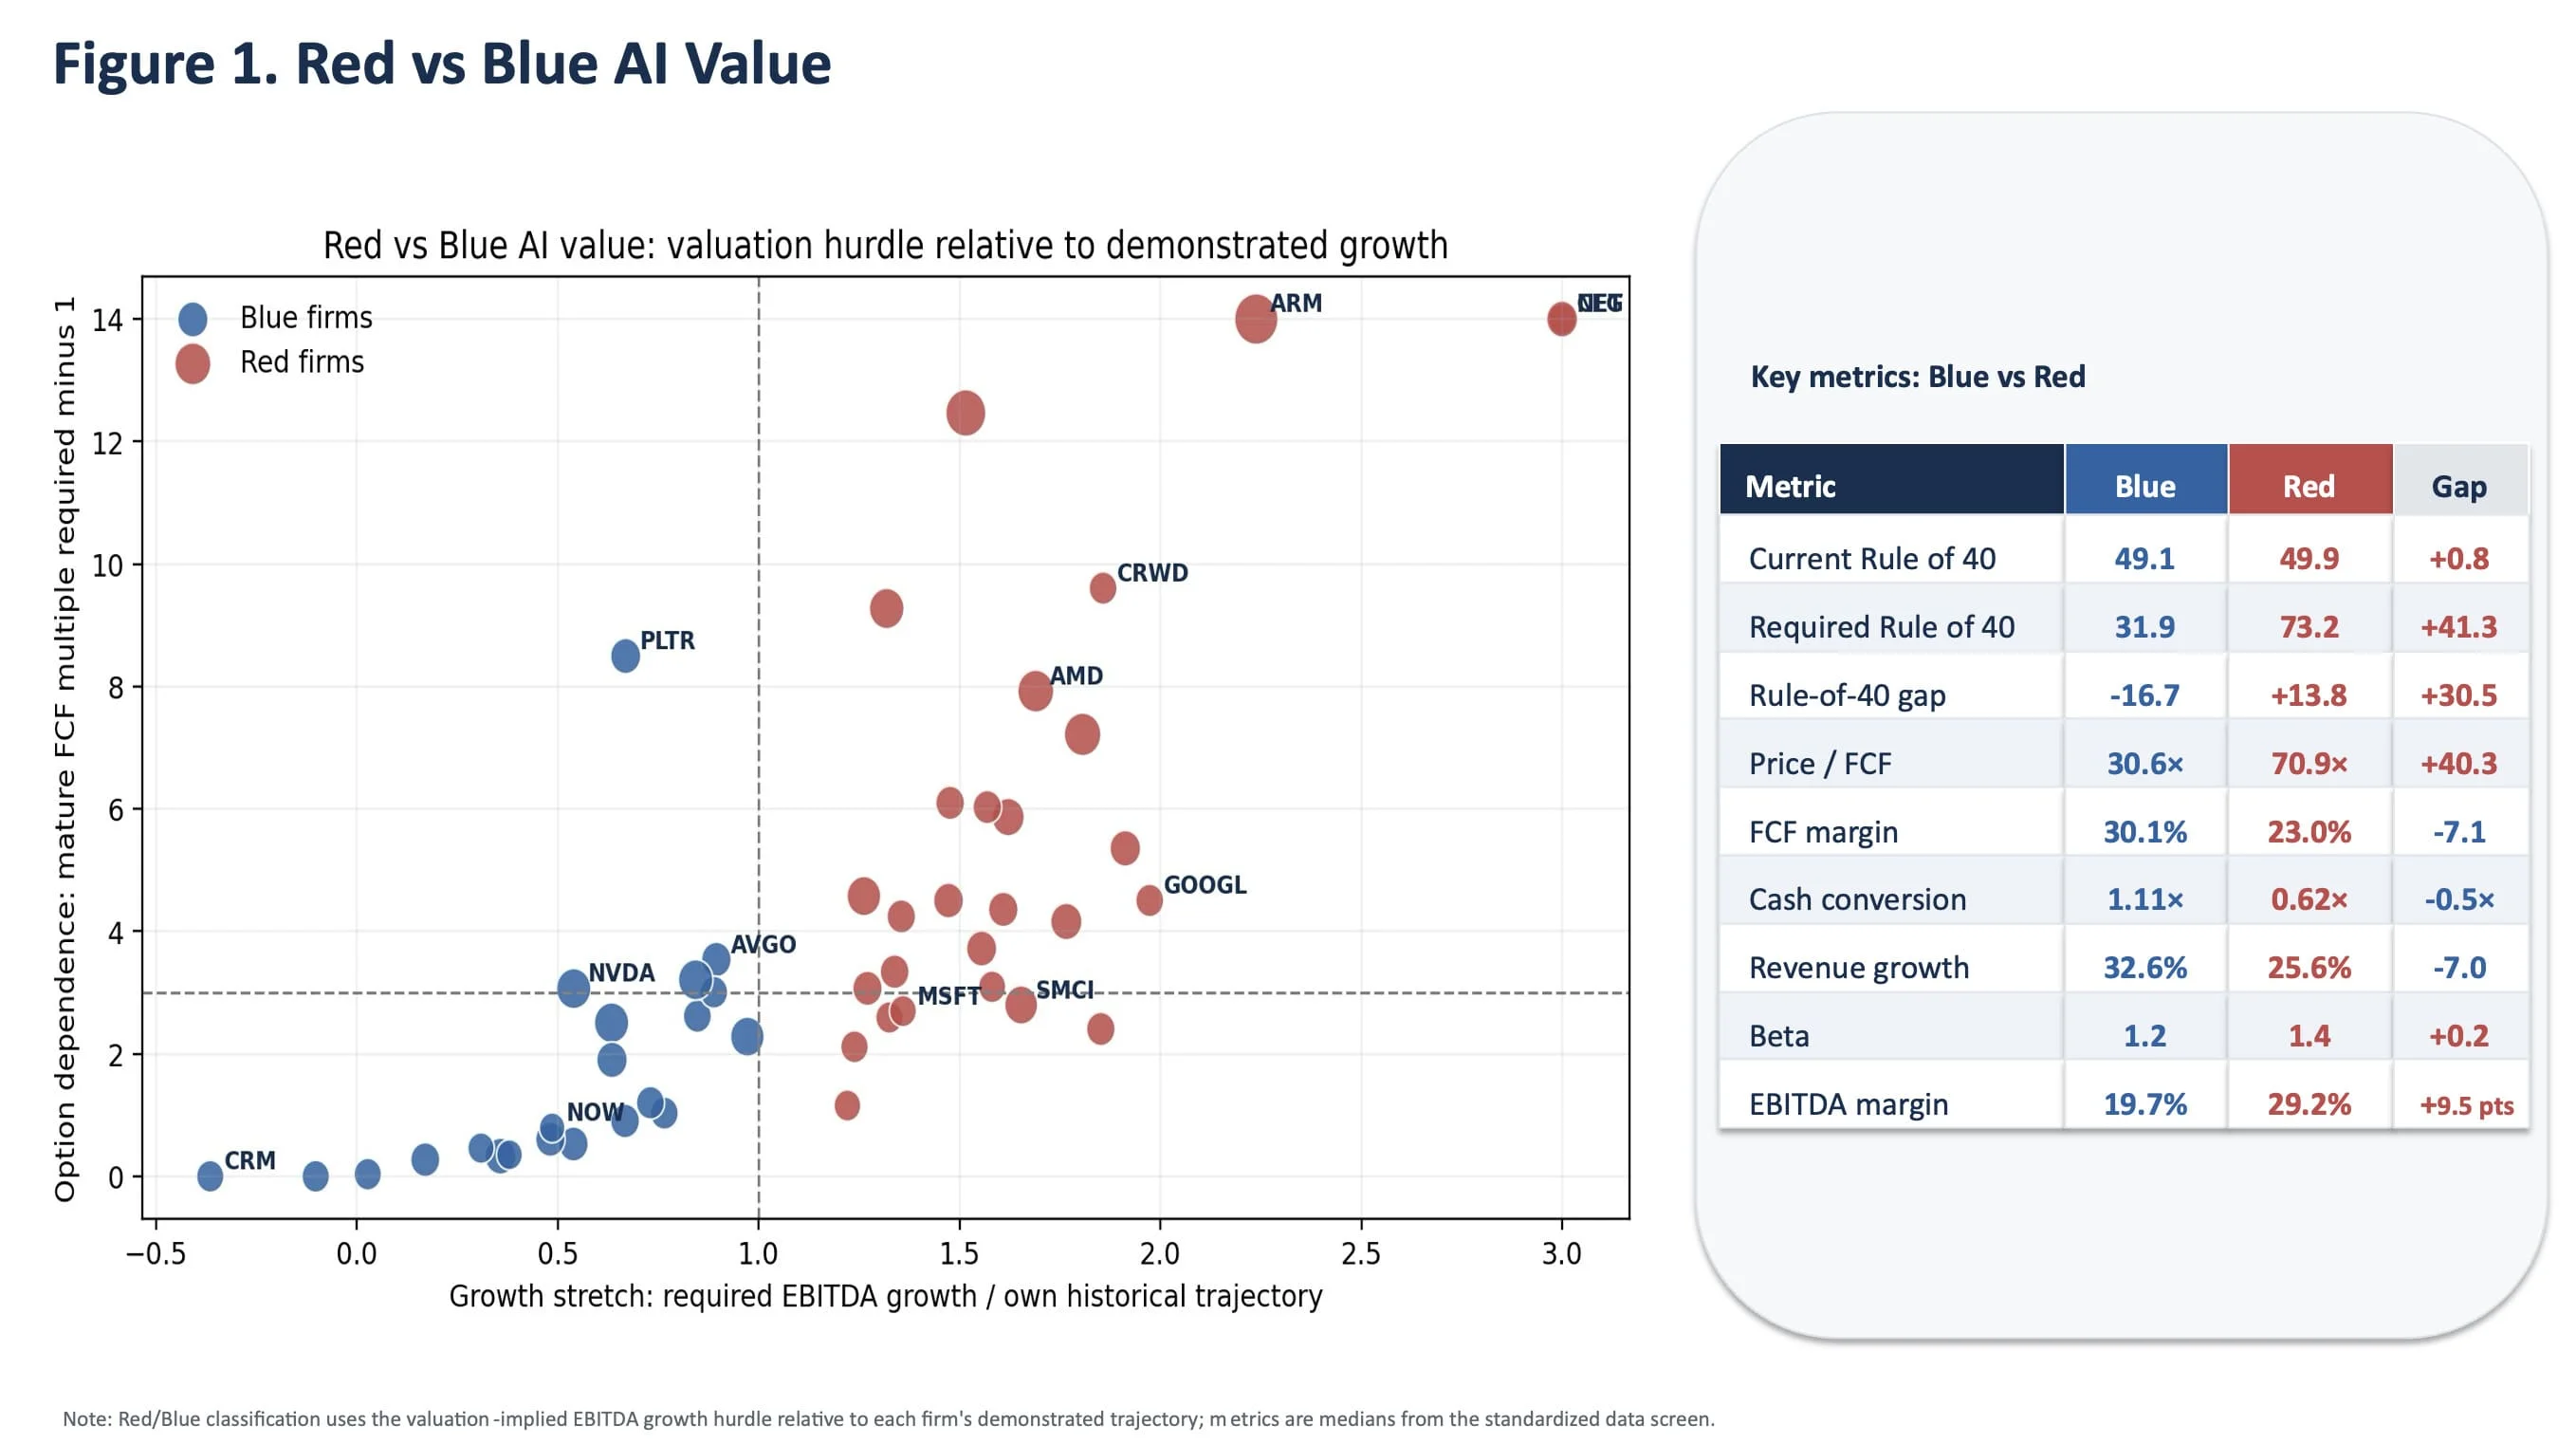
Doing this reengineering valuation exercise implies the typical company in the 50-company universe ultimately needs roughly three to five times today’s cash-flow base, depending on assumptions. For the average company in this world, that is indeed demanding, but for most tech leaders, this is not automatically implausible. Beyond the average, dispersion is more revealing. We separate firms into “Blue” companies, whose valuation-implied growth is within a demonstrated (past) company or peer trajectory, and “Red” companies, whose prices require an operating regime stronger than the demonstrated benchmark. The first surprising result is that the two groups have roughly the same market capitalization and are almost equally strong today. Their median current Rule-of-40 scores are roughly 49 and 50, respectively, or very strong and unique economic profile.
The true difference is tomorrow: Blue firms require a declining (versus current) Rule-of-40 score of roughly 32, while Red firms require approximately 73 in the standardized actual-data specification. Thus, the central question is not whether Red companies can reach Rule of 40—they already exceed it—but whether a Rule-of-50 company can become a sustained Rule-of-70 company performance (Figure 1 and Figure 2).
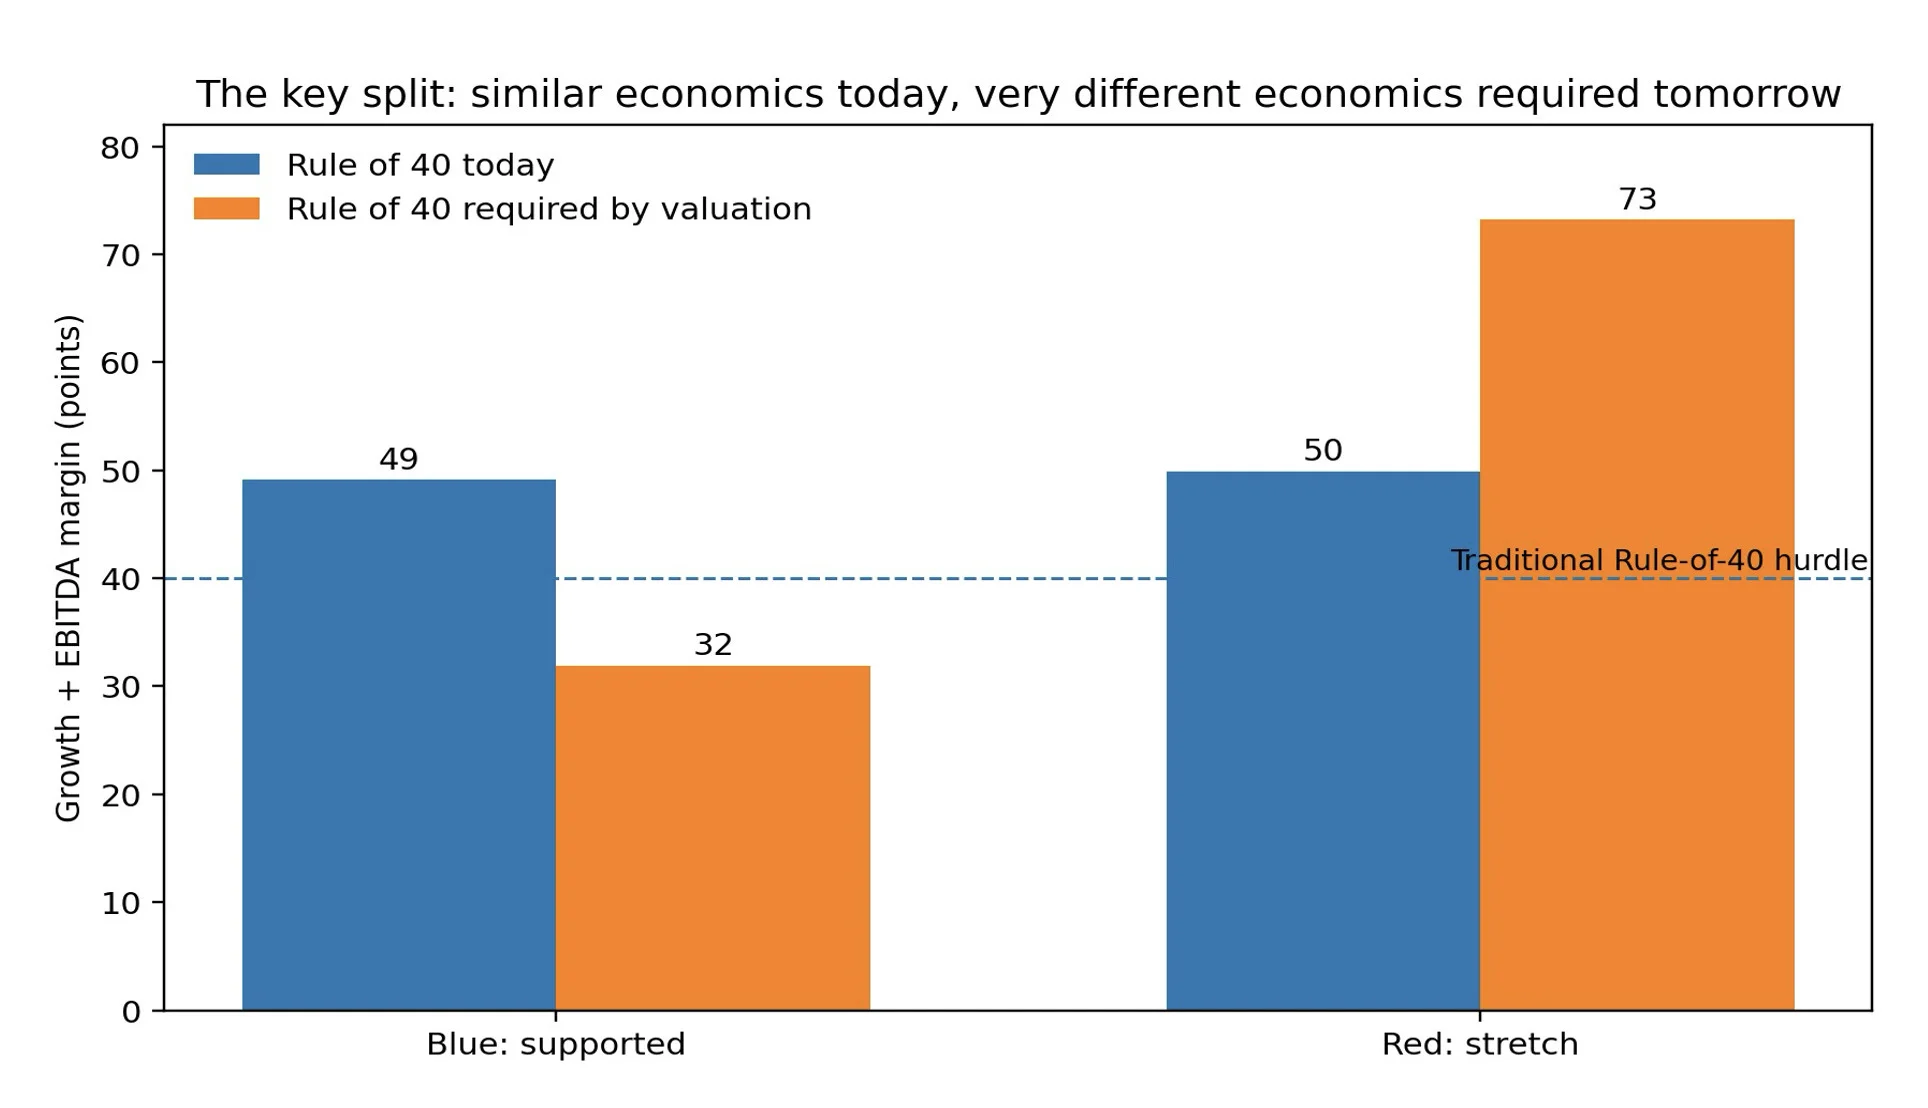
Said differently, Blue firms are excellent and must remain good (but not necessarily with the same momentum). Red firms are also good, but markets want them even better.
Closing the Red Gap
How to close the gap and become even better? A natural hypothesis is that Red firms simply have weaker margins, and can improve significantly more in the future. The data do not support that interpretation. Median EBITDA margin is actually higher for the red firm.
The more useful distinction is cash conversion, or how much of the EBTITDA generated becomes cash to shareholders.
The approximate medians are Looking further at where the cash goes, it would go to new investment spending. The key, of course, is that those investments must return their cost of capital. Computing those returns, the good news is that the hurdle is passed by 90% of both “red” and “blue” firms. But the “red” firms see a J-curve in cash conversion, where the investment spent becomes cash accretive after 18-24 months, while “blue” companies are spending less and have already stronger cash-generating investments. The market is thus looking at the “red” companies as the new AI cycle spenders, with hope of strong returns and scale to deliver on their rule of 70. Datadog provides a useful example of how a valuation-stretched company can begin to close the gap. In the available sequential data, revenue growth accelerated from 32% in Q1 to 36% in Q2, while Datadog reported that MCP Server tool calls had quadrupled quarter over quarter and spans sent to its LLM Observability product had nearly tripled. Salesforce provides the opposite measurement lesson. Agentforce ARR moved from approximately $800 million to $1.2 billion across sequential reporting points, with reported year-over-year growth accelerating from 169% to 205%. That is spectacular commercialization. Yet Agent force remained a low-single-digit share of Salesforce’s total economic scale.
Resilient Performance
Current momentum is valuable only if it persists long enough. The evidence does not yet establish cumulative advantage, however. Some individual firms, including DigitalOcean and Salesforce, are consistent with reinforcement, but companies starting with greater AI momentum do not yet systematically show greater subsequent acceleration over the short observation window.
Still, The analysis suggests a clear correlation between the successful “red” of today (strong cash flow from AI and good AI momentum) and others, where those companies are even not required to sustain current momentum (However, there is also a small portion (<20%) lagging AI and low returns in the red sample: those must do 2-3 times their momentum to limit their risk of a bubble (figure 3)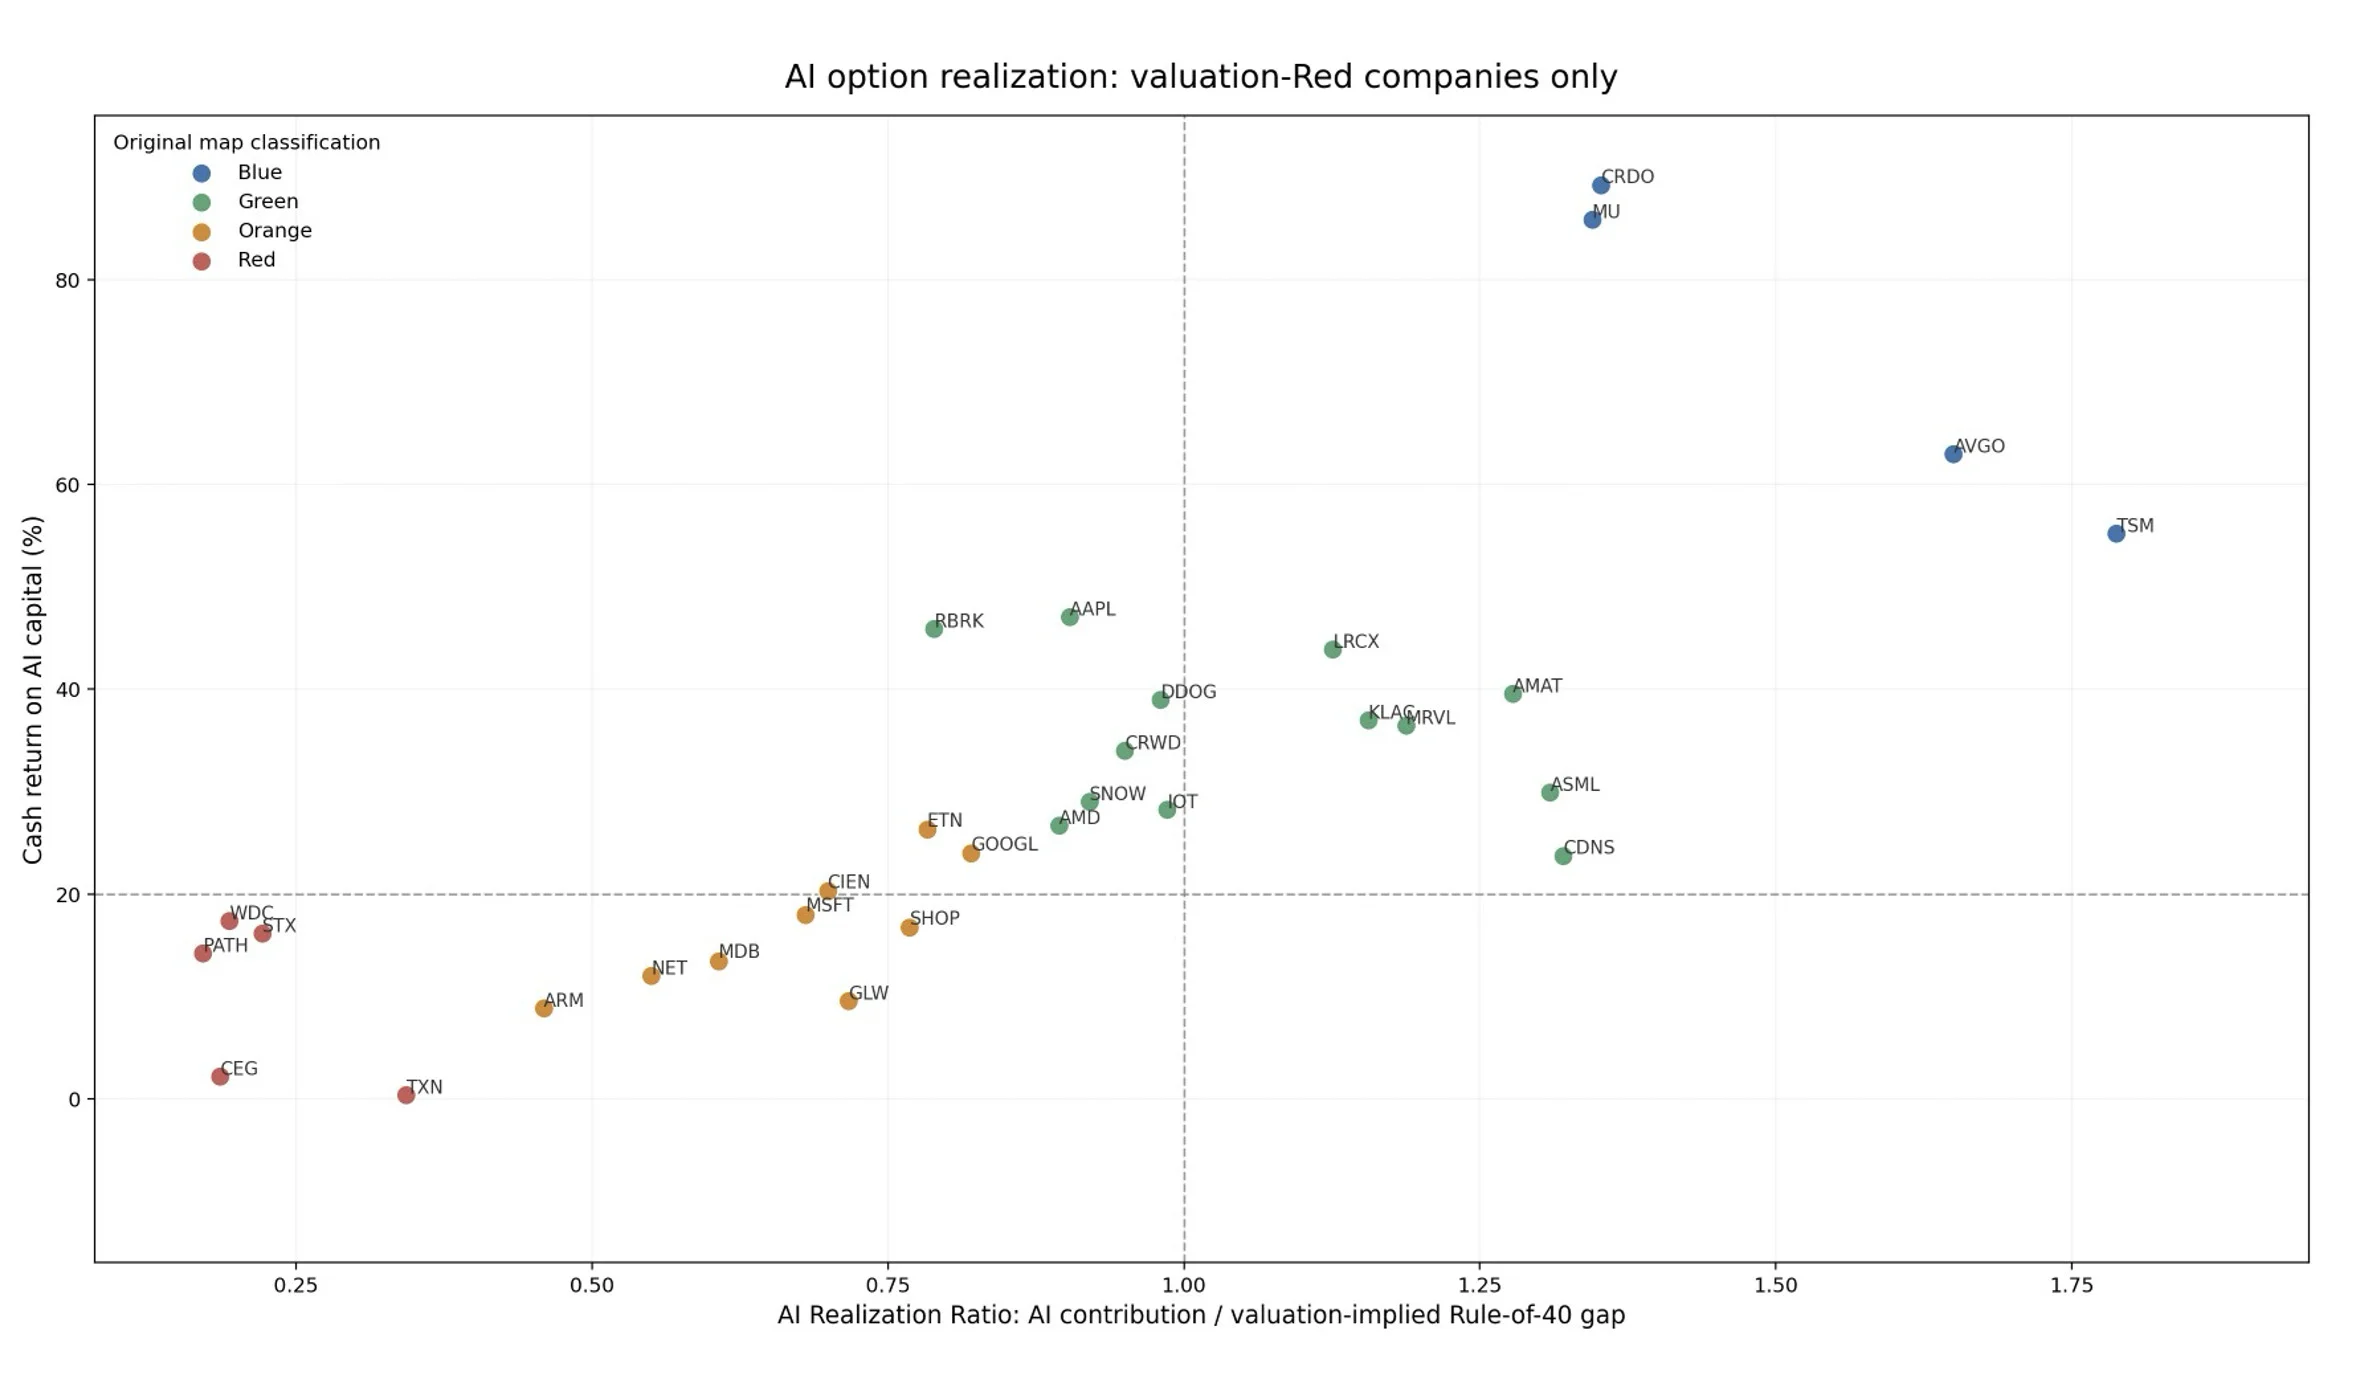
So, is AI A Bubble?
The evidence supports neither the simplest bullish nor the simplest bearish conclusion. Historical warning signals are clearly present. Market concentration is unusually high. Equity values have risen dramatically. A large amount of future optionality is capitalized into current prices. Academic evidence suggests that such run-ups increase crash risk even when the underlying technological revolution is real.
Academic evidence suggests that such run-ups increase crash risk even when the underlying technological revolution is real.
But today’s AI leaders also exhibit operating characteristics unlike those of many companies at the center of classic speculative episodes. They grow rapidly, often at very large scale. They generate high margins. Many produce substantial cash. The independent software evidence further suggests that measurable commercial AI activity is already associated with a widening revenue growth frontier, despite still representing a small portion of the total revenue of those tech firms. Most importantly, the roughly 14.8-point observed growth difference between the full software panel and the highest-AI-momentum quintile is economically large enough to make much of the typical Red company’s roughly 20-point Rule-of-40 gap conceivable. The remaining requirements are persistence, margin leverage, cash conversion, and capital productivity.
AI itself does not have to fail. The companies can remain excellent. They can stay above the Rule of 40. They can continue to grow rapidly. Their stocks can still fall because an extraordinary future is already in the price and reality turns out to be merely very good.
About the Author
 Jacques Bughin is the CEO of Machaon Advisory and a former professor of Management. He retired from McKinsey as a senior partner and director of the McKinsey Global Institute. He advises Antler and Fortino Capital, two major VC /PE firms, and serves on the board of several companies.
References
-
Acemoglu, D., & Restrepo, P. (2019). Automation and new tasks: How technology displaces and reinstates labor. Journal of Economic Perspectives, 33(2), 3-30.
-
Bresnahan, T. F., Brynjolfsson, E., & Hitt, L. M. (2002). Information technology, workplace organization, and the demand for skilled labor: Firm-level evidence. Quarterly Journal of Economics, 117(1), 339-376.
-
Brunnermeier, M. K., & Nagel, S. (2004). Hedge funds and the technology bubble. Journal of Finance, 59(5), 2013-2040.
-
Brynjolfsson, E., Hitt, L. M., & Yang, S. (2002). Intangible assets: Computers and organizational capital. Brookings Papers on Economic Activity, 2002(1), 137-181.
-
Cockburn, I. M., Henderson, R., & Stern, S. (2019). The impact of artificial intelligence on innovation: An exploratory analysis. In A. Agrawal, J. Gans, & A. Goldfarb (Eds.), The Economics of Artificial Intelligence: An Agenda. University of Chicago Press.
-
Greenwood, R., Shleifer, A., & You, Y. (2019). Bubbles for Fama. Journal of Financial Economics, 131(1), 20-43.
-
Kaplan, S. N., & Schoar, A. (2005). Private equity performance: Returns, persistence, and capital flows. Journal of Finance, 60(4), 1791-1823.
-
Ofek, E., & Richardson, M. (2003). DotCom mania: The rise and fall of Internet stock prices. Journal of Finance, 58(3), 1113-1137.
-
Pástor, Ľ., & Veronesi, P. (2006). Was there a Nasdaq bubble in the late 1990s? Journal of Financial Economics, 81(1), 61-100.
-
Pástor, Ľ., & Veronesi, P. (2009). Technological revolutions and stock prices. American Economic Review, 99(4), 1451-1483.
-
Teece, D. J. (1986). Profiting from technological innovation: Implications for integration, collaboration, licensing and public policy. Research Policy, 15(6), 285-305.