


A business question can look simple at the start of a notebook: Why did margin fall last quarter? Which customer segment changed its purchasing pattern? Is a regional sales decline caused by lower demand or a change in pricing? The difficulty comes later. As filters are changed, missing values are handled and alternative comparisons are tested, the notebook accumulates decisions that may be obvious to the analyst at the time but hard to reconstruct when the result is reviewed days later.
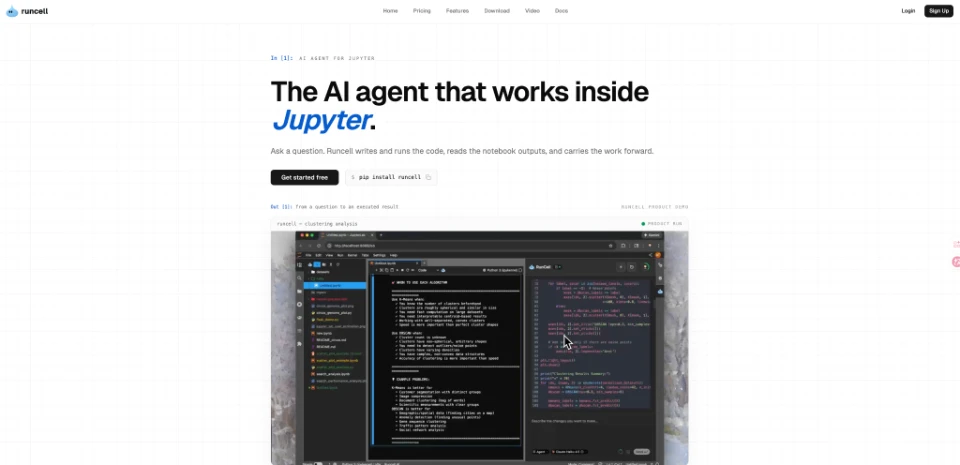
Advice on reproducible analysis often focuses on cleaning code after the work is finished. That misses an important part of business analysis: the reasoning that connects a question to a result. A notebook-native option such as RunCell can be explored when the friction lies between a business question, the Python needed to test it and the output that follows. The more useful standard is a visible decision trail: Decision → Assumptions → Tests → Evidence → Decision Record. Each stage should make the next one easier to inspect rather than forcing reviewers to infer how the conclusion was reached.
Build the Analysis Around One Decision
The first stage is to define the decision the analysis is meant to support. “Explore customer churn” is a topic, not a decision. “Should the retention team prioritise customers whose usage fell in the last 60 days?” creates a boundary around the work. It identifies the action under consideration and makes it easier to judge whether a calculation is relevant.
That distinction prevents notebooks from expanding without purpose. If the decision concerns a retention campaign, a detailed study of acquisition channels may be interesting but unnecessary unless it changes the retention choice. Every additional transformation, chart or model should earn its place by helping to confirm, reject or qualify the decision under review.
A simple check is to write the proposed action in one sentence before analysing the data. Then ask what evidence would change that action. If no possible result would alter the decision, the analysis is probably documenting a preference rather than testing one.
Make Assumptions Visible Before Running Tests
Once the decision is defined, the next risk is hidden assumptions. Business questions contain choices about time periods, definitions, exclusions and comparison groups. If those choices remain implicit, two analysts can use the same dataset and reach different answers without either making an obvious coding error.
1. Define the Business Question
Translate the decision into a question with measurable terms. Instead of asking why sales weakened, ask whether the decline came primarily from fewer orders, lower average order value or a change in product mix during a defined period. This gives the notebook a set of competing explanations rather than an open-ended invitation to search for patterns.
2. Record the Data Boundaries
Write down which dates, markets, customer groups and records are included before applying them in code. If refunded orders are excluded, state why. If one region has incomplete reporting, flag it before comparisons are made. These notes do not need to be long; their purpose is to stop a later reviewer from mistaking a filtering choice for a fact about the business.
3. Set the Comparison Before Testing
Choose the comparison that matches the decision. A year-on-year comparison may control for seasonality, while a month-on-month view may be more useful for a recent operational change. The important point is to decide before seeing which comparison produces the most convenient result. If the comparison changes later, the notebook should show the reason for the change.
These three steps create the conditions for useful testing. The notebook now has a defined decision, explicit boundaries and a comparison rule. The next stage can focus on evidence rather than repeatedly redefining the question.
Turn Each Finding Into a Test
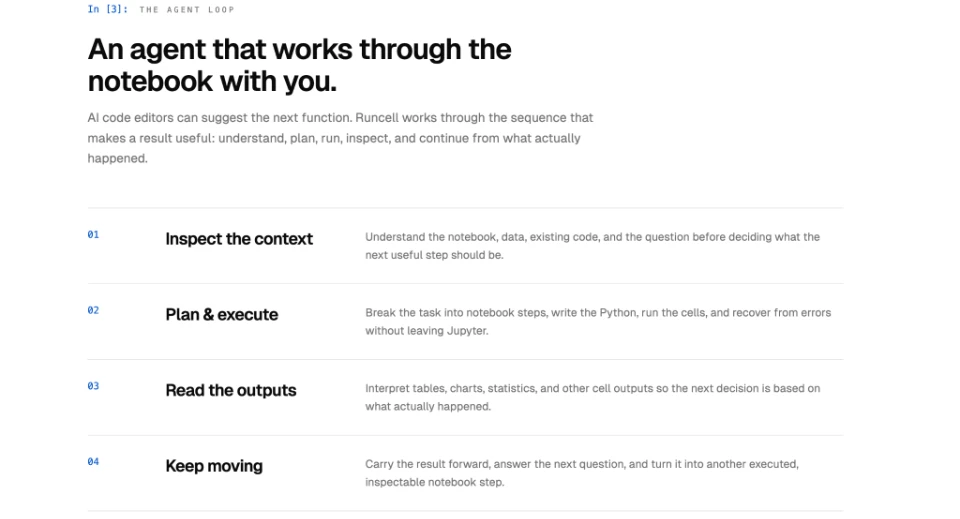
With assumptions visible, analysis can proceed as a sequence of targeted tests. Suppose gross margin declined in one quarter. The first test separates price, unit cost and sales mix. If unit cost explains most of the movement, the next test might compare suppliers or product families. If the change instead comes from mix, the investigation follows a different branch.
This approach keeps each cell connected to a reason. A chart is not added because the dataset contains dates; it is added because a time pattern could distinguish between two explanations. A groupby is not useful merely because it is quick to write; it is useful when the grouped result can change the next analytical choice.
When an initial comparison exposes an unexplained shift, a Jupyter AI agent can be used with the current question and notebook context to write and execute a targeted follow-up, then inspect the table, chart or other output produced. The analyst should still check that the chosen filters and comparison period match the original decision before accepting the new branch of analysis.
The stopping rule matters as much as the next test. If a finding is stable across the relevant comparison, survives basic data-quality checks and is sufficient to support the decision, adding more analysis may reduce clarity rather than improve it. Continue only when the current evidence leaves a material uncertainty that another test can realistically resolve.
Preserve the Evidence Behind Each Result
A result becomes difficult to defend when the notebook shows the final chart but not the choices that produced it. Traceability depends on preserving enough evidence to reconstruct the path without turning every cell into a formal report.
For important outputs, keep the transformation close to the result it creates. Avoid overwriting a key dataframe repeatedly when later steps depend on different versions of it. Use names that show what changed, and keep short notes where an exclusion, replacement rule or unusual calculation affects interpretation. The point is not perfect documentation; it is making consequential changes visible.
Review the notebook as if the original analyst were unavailable. Can another person identify the source data, see which records were excluded, understand the comparison and reproduce the figure that supports the decision? If the answer requires guessing, the evidence trail is incomplete.
This review also helps expose false confidence. A polished chart may depend on a narrow date window, a missing category or a changed denominator. Traceability makes those choices easier to challenge before the conclusion moves into a presentation, forecast or management discussion.
Keep the Decision Trail Intact
Decision-ready analysis is built by preserving the connection between five things: the decision being considered, the assumptions that define the test, the tests that generate evidence, the evidence that survives review and the final judgement. When those parts remain connected, a notebook does more than produce an answer. It shows why that answer is relevant and what would have caused the analyst to reach a different one.
The habit scales beyond a single project. Start each notebook with the decision, expose material assumptions before testing them, let each finding justify the next test, and preserve the outputs needed to retrace the reasoning. Over time, this creates notebooks that are easier to review, hand over and revisit when business conditions change or previous conclusions come under later scrutiny. Speed still matters, but it becomes useful speed: less time reconstructing old reasoning and more time deciding whether the available evidence is strong enough to act on.
Disclaimer: This article contains sponsored marketing content. It is intended for promotional purposes and should not be considered as an endorsement or recommendation by our website. Readers are encouraged to conduct their own research and exercise their own judgment before making any decisions based on the information provided in this article.