By Jorge Sá
Most businesses were taken completely off-guard when the COVID crisis hit. The absence of historical data on such an event meant that the epidemic represented uncharted waters for everyone. But what if we look for similarities in a similar event for which we do, indeed, have data?
The European economy declined by 6.1 per cent in 20201 and, while recovery is on the way, many economists and institutions do not expect a full recovery before the end of 2023, and that is without taking into consideration the possibility of the appearance of virus variants.2,3,4,5,6,7,8
Machiavelli, however, recommended never to waste the opportunities created by a good crisisI.
But where can we find opportunities amid the present (COVID) and any future crisis? The answer requires us to address three questions.
- First: since the only new is the past that one ignores (H. Truman), were there resilient businesses during the last major (subprime) crisis?9,10,11
- Second: if so, can one find general explanations for those booming activities unrelated and thus independent of the specific cause of a given crisis (be it massive loan defaults or a pandemic)?
- Third: and finally, does the existent data for the 2020 COVID year confirm the same opportunities of the subprime crisis period (the years 2008 to 2014)?
If so, that would be another example showing that (as Peter Drucker, founder of modern management, said) behind any risk there is an opportunity – activities which grow, not just in spite of, but even because of recessions.
Types of resilient businesses
During the subprime crisis (the years 2008-2014) there were indeed two types of resilient businesses. Some kept on growing, while others even accelerated their growth compared to the pre-crisis period (the years 2000 to 2007II).
And that applies to industries whether they were consumer goods, industrial products or services (and there are 88 industries in the economyIII), or to segments, that is industry subdivisions (and they total 615 in the economyIII.
Resilient industries

Indeed, during the subprime crisis (2008 to 2014), some industries kept on growing, while others even accelerated their growth.
An example of the former is Eurostat industry 32, which grew yearly by 1.8 per cent and covers 1) the manufacture of sports goods (for outdoor and indoor), 2) imitation jewellery (rings, bracelets, and necklaces), 3) games and toys (including electronic games), and 4) musical instruments (string or keyboards).
And an example of an industry which accelerated its growth is publishing activities (code 58), which changed from zero growth in the pre-crisis years (2000-2007) to +1.2 per cent during the subprime (2008-2014): books, magazines, and newspapers, as well as other publishing activities, such as photos, engravings, greetings cards, posters, and computer games.
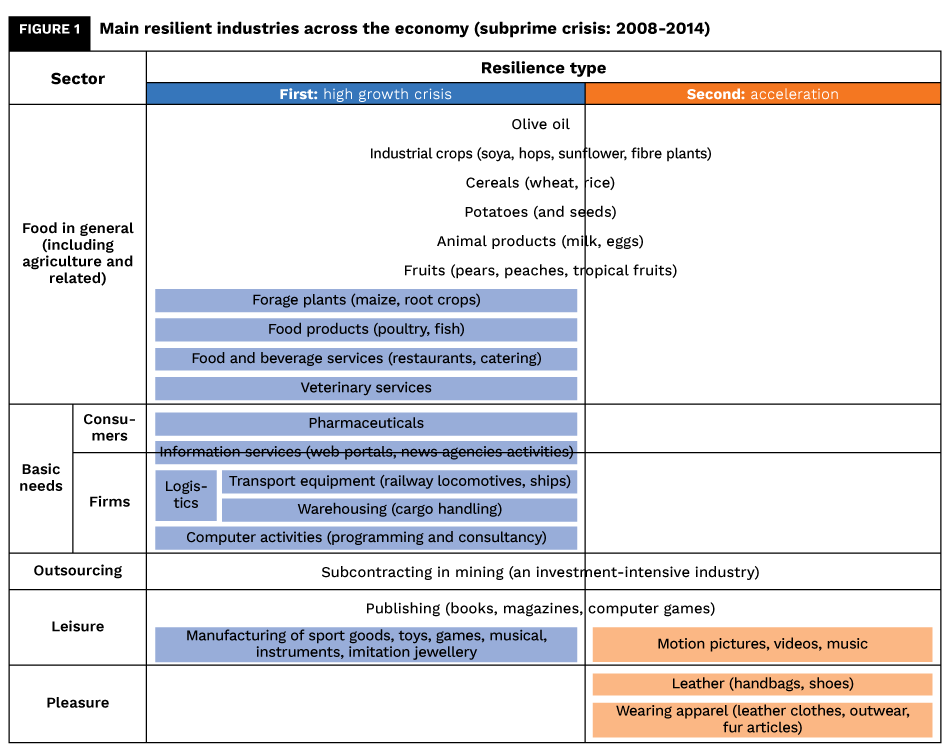
Figure 1 indicates the sectors where most of the resilient industries can be found, because they grew and / or intensified their growth.
When an industry has only one type of resilience, it is underneath a single column. When it has both it is in the middle of the two columns. And within brackets are some examples of the products contained within each industry.
As per figure 1, some industries grew, but did not accelerate, e.g., forage plants (maize, root crops, etc.): 1.2 per cent growth during the subprime and 1.4 per cent before.
Others accelerated, but did not grow, such as leather products (handbags, footwear): from -6.2 per cent before to -3.1 per cent during the subprime.
And still other industries both grew and accelerated, such as olive oil: from zero to nearly 7 per cent growth; or fruit, from 1 per cent to 1.6 per cent.
In general, resilient industries can be found first of all in “Food in general” (including agriculture and related activities); 1) they are a basic need, 2) in crisis people have more free time, and 3) they are a source of comfort.
Then there are other essential needs which cannot be postponed, either for consumers, such as pharmaceuticals (3.2 per cent growth during the subprime, representing a -1.5 per cent slowdown relative to the pre-crisis period), or for companies: everything related to logistics (transport equipment with 0.3 per cent growth, and warehousing with 0.2 per cent growth) and computer programming and consultancy (1.2 per cent growth). Further, there are still fundamental needs for both consumers and companies; e.g., information services (web portals, news agencies), with almost 6 per cent growth in spite of a -2.3 per cent slowdown relative to the pre-crisis period.
Then, in times of uncertainty, firms opt for outsourcing as a source of flexibility instead of performing tasks internally, especially in investment-intense industries such as mining. Hence the acceleration from -0.2 per cent to +2.8 per cent.
More leisure time explains why publishing (from books to computer games) accelerated from zero to 1.2 per cent growth. And the need for pleasure is the reason that goods such as handbags or shoes, in leather as well as imitations, and wearing apparel (from fur skins to, again, leather), is translated into superior performance with acceleration of 3.1 per cent and 2.4 per cent, respectively.
In short: 1) essentials, for consumers, firms, or both (information); 2) flexibility; 3) free time; 4) comfort; and 5) pleasure. Those are the dominant reasons for resilient industries.
But, while figure 1 indicates resilience in terms of industries (in growth and acceleration), there is still another type of resilience, namely within each industry, in terms of its subdivisions and segments, and regardless of whether or not the industry itself is in general resilient.
That is, independently of how the industry performed overall during subprime, one can find within its industries segments which excelled, in consumer goods, industrial products, or services.
Food products exemplify segments within an industry which was resilient and is a consumer good.
Chemicals and equipment repairs as industrial products and services illustrate segments within industries which on average were non-resilient.
Resilient segments: excellence within industries

The food products industry (meat, fish, bread, fruit) grew on average during the subprime crisis of 2008-2014 at 0.4 per cent annually (1.7 per cent in the pre-crisis years of 2000-2007), but the industry average value hides considerable variance.
Poultry meat, together with soups, sandwiches, and uncooked pizzas, all increased by 1.1 per cent during the subprime years, and fruit and vegetables by 0.8 per cent.
But prepared meals and dishes, as well as all types of juice (of fruit and vegetables) and ice creams decreased by -1.4 per cent, -2.9 per cent and -5 per cent, respectively (ice cream before the crisis was increasing at 3 per cent).
Summarising, it can be said that within food products, four main patterns emerged during the subprime.
Three categories were “abandoned”: convenience items (prepared meals and dishes), expensive pleasure products (seafood, smoked fish), and specialities (patés and salami). Within each category, cheaper substitutes were sought: processed vegetables instead of dietetics; poultry instead of beef and lamb; and so on.
Essentials, such as grain mill products (wheat and rice) held their ground, growing at a rate of 0.8 per cent, as well as dairy products (milk, cheese) at 0.7 per cent.
And low pleasure-inducing products accelerated their growth: macaroni, noodles, couscous, etc. from 0.1 per cent (pre-crisis) to 0.4 per cent (during the crisis).
Chemicals is an example of a non-resilient industry (it declined overall at 0.7 per cent per year during the subprime), with some segments such as glues (plus adhesives) and explosives (mostly used in construction and mining) diving by -4 per cent and -6.2 per cent, respectively.
However, within chemicals, the food-related segment of agrochemicals increased by 3.8 per cent, extracts and aromatic products for perfumes and food grew by 2.6 per cent and perfumes and toilet preparations (make-up preparations, shampoos, toilet water, cosmetic soaps) grew by 1.6 per cent.
Equipment repairs and installation is an example of a non-resilient service, as its average declined from the pre-crisis to the crisis from +3.1 per cent to -0.4 per cent. But there is a single exception in a segment whose growth accelerated (from 0.8 per cent pre-crisis to 4.5 per cent during the crisis), namely repairs which could not be postponed at all: metal tanks, pipelines, steam generators, and central heating boilers.
In short, one can always find exceptional segments with an industry, regardless of whether it is a consumer product, an industrial good, or a service, and independently of whether the industry as a whole was, on average, resilient or non-resilient during the subprime years (2008-2014).
So the question is: how can a firm use this information?
How to find resilient businesses and what to do with them
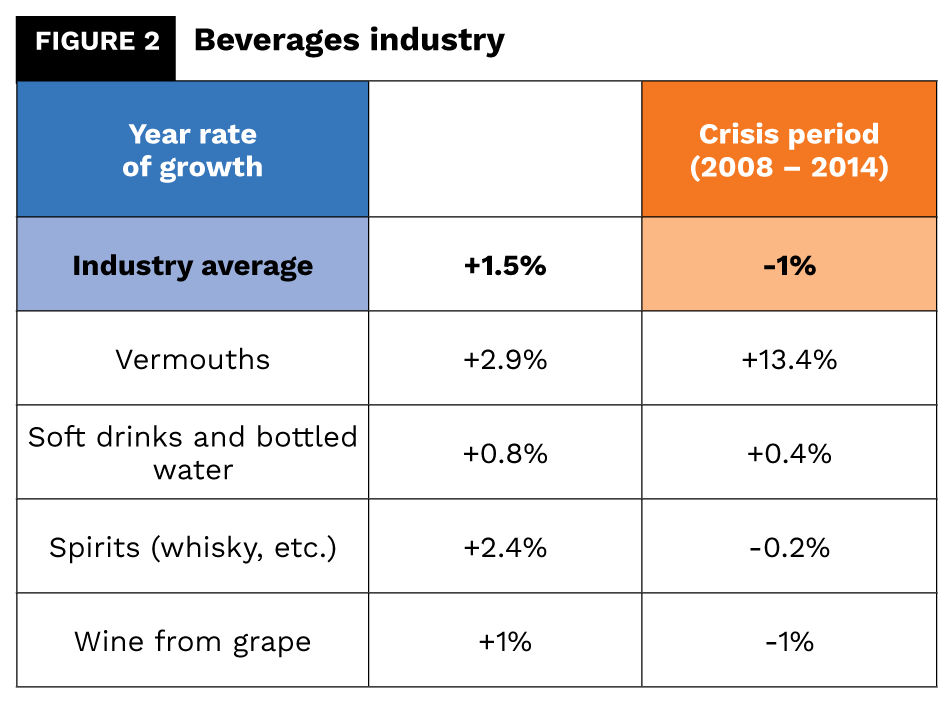
Figure 2 presents a very simple description of the beverages industry, with four segments: 1) vermouths, 2) soft drinks and bottled water, 3) spirits such as whisky, and 4) wine from grapes, all with data taken from the Eurostat database.
The industry has other segments such as beer, cider, fruit wines, etc., but to simplify let’s focus on the four above.
As can be seen, vermouths is by far the most resilient segment: its growth rate accelerated from +2.9 per cent (pre-crisis) to +13.4 per cent (crisis), although the industry declined on average from +1.5 per cent to -1 per cent.
And so a firm working in the beverages industry has four basic options: 1) concentration; 2) entry; 3) becoming a supplier; or 4) holding its ground.
If the company is operating in several segments such as vermouths, spirits, and soft drinks and bottled water, the sensible decision is to concentrate on the first option, as it not only benefits from the highest growth (+13.4 per cent) but also exhibits the greatest acceleration (+10.5 per cent). Thus the company’s strategy should be focus.
However, if the organisation is specialised in spirits, whose rate of growth during the crisis is -0.2 per cent (a 2.6 per cent decline from pre-crisis), it may consider the option of entering the vermouth segment, since of all the products, it is the most similar (and thus synergetic) segment to spirits (whisky, etc.).
Still, a wine producer can become a supplier to the vermouth segment and thus minimise the 2 per cent deceleration effect while benefiting from supplying a segment (vermouth) growing at +13.4 per cent.
Finally, a soft drinks and bottled water manufacturer will not have great synergy with vermouths, so it would be difficult to move into that segment, but neither would there be a great need.
The best strategy for a specialised soft drinks and bottled water supplier would be to hold its ground and maintain its operations in that segment.
There are two reasons for this. First, the segment grew during the crisis, although less than pre-crisis (a slowdown from +0.8 per cent to +0.4 per cent). And second, except eventually in marketing (some distribution channels, for example), there might not be important synergies with the other industry segments, and certainly not in operations and manufacturing.
All these four options – focus, entry, become a supplier or hold its ground – correspond to moves within the boundaries of a company’s industry, since here synergy is greatest in marketing (channels of distribution, image, sales force, etc.) and / or technological (manufacturing).
However what if, exceptionally, no resilient segment exists within a firm’s industry, or the company lacks synergy to move into it?
Then the option is to analyse figure 1 before, search there for the most similar and thus synergetic industry or industries and perform in it the same analysis done here regarding figure 2.
A final point is that data regarding the years of the subprime period (2008-2014) should always be confirmed with that of the COVID year, 2020, just as was done for all the statistics in this article.
Conclusion: Chronos and Kairós, the gods of time

Ancient Greeks revered two gods of time.
Chronos was the god of the everlasting, of repetition, of the chronological sequence of seasons and years, measured quantitatively.
And Kairós was the god of opportune timing, of the specific moment where something special happens, so this is measured qualitatively, not quantitatively.
Thus the latter is the god of the ability to adapt to and take advantage of changing, contingent circumstances, of that special instant when an opening appears which, if driven through, leads to success.
But time is indeed composed of both gods. There are the regular, “normal” times, with incremental changes and evolution, which corresponds to the growth periods in the economy.
And then there are crises, recessions, when, rather than alterations, great disruptions occur. Some activities keep on growing; others accelerate their growth. And consequently, the whole structure of the economy changes, with great opportunities appearing.
Tropical fruit? Reversed their yearly growth rate, from -1.2 per cent in the pre-crisis period (2000-2007) to +1.2 per cent during the subprime years (2008-2014), in contrast to dessert grapes, which went downhill by -3.1 per cent (from basically stable in pre-crisis to -3.1 per cent during the crisis).
Sports goods? These improved their performance by nearly 5 percentage points, while kitchen furniture dived by -7.3 per cent (from 2 per cent growth pre-crisis to -5.3 per cent during the crisis). And so on.
Thus, the problem with crises is not the lack of opportunities, but failing first to recognise that they exist – and then the absence of a methodology to find them.
In either case, blame should not be directed outwards, but inwards, since in the struggle for survival, not to be competitive is almost to be guiltyIV.
About the Author
 Jorge Sá is a senior research fellow at Drucker University (Peter F. Drucker and Masatoshi-Ito Graduate School of Management) in Los Angeles, and a professor at ISG Business School. He is an expert on Peter Drucker and Philip Kotler, founders of modern management and modern marketing, respectively, with whom he studied and who offered letters of recommendation for his books and endorsements for his work. He has a master’s degree from the Peter F. Drucker Graduate School of Management in California and a doctorate (PhD) in Business Administration, from Columbia University, where he was a student, researcher, and teaching assistant. He was awarded the Jean Monnet Chair by the Jean Monnet Foundation in Brussels and has published books in 12 languages.
References
- AMECO (2021, May 13). https://ec.europa.eu/info/business-economy-euro/indicators-statistics/economic-databases/
- Fernandes N., “Economic effects of coronavirus outbreak (COVID-19) on the world”, IESE Business School Working Paper No. WP-1240-E, 22 March 2020
- Mukut S., Wenzheng Z., Ujjal A., “Consequential impact of the COVID-19 pandemic on global emerging economy”, American Journal of Economics, 10(6): 325-331; 2020
- Ozili P. K., Arun T., “Spillover of COVID-19: impact on the global economy”, 27 March 2020
- Roy S., “Economic impact of COVID-19 pandemic”, 27 July 2020
- Lorenzo M., Lean A., “The economic impact of COVID-19”, IDOSR Journal of Banking, Economics and Social Sciences, 5(1): 45-50; 2020
- Sapir A., “Why has COVID-19 hit different European Union economies so differently?”, Policy Contribution 2020/18, Bruegel; 2020
- Ehnts D., Paetz M., “COVID-19 and its economic consequences for the Euro Area”, Eurasian Economic Review, 11: 227–49; 2021
- Moore T., Mirzaei A., “The impact of the global financial crisis on industry growth”, The Manchester School, Vol. 84, No. 2: 159-80; 2016
- Setar L., MacFarland M., “Top 10 fastest-growing industries”, IbisWorld, Special report; April 2012
- Khudyakova T., Shmidt A., “Impact of the global recession in financial and economic sustainability of industrial companies”, European Research Studies Journal, Volume XXII, Issue 1: 143-57; 2019
I In his work The Prince, dedicated to Lorenzo de Medici.
II For reasons of homogeneity, one defines the pre-crisis period as starting with the millennium.
III Eurostat generally defines industries with two digits and segments with four digits. Five Eurostat databases were used:
– Production in industry;
– Economic accounts for agriculture;
– Annual detailed enterprise statistics for construction;
– Annual detailed enterprise statistics for trade; and
– Annual detailed enterprise statistics for services.
IV Charles Darwin