By Jorge Sá & Paulo Rodrigues
In a world in which, somewhat surprisingly, there is still a lack of consensus among economists as to precisely what factors engender economic growth in any given country, might we gain a useful new perspective by comparing and contrasting the context of countries with that of companies?
Solow’s ignorance
A few years ago, I participated in a conference in a developing country, presenting how Peter Drucker’s ideas are still relevant in today’s world. The keynote speaker was Paul Krugman, the Nobel Prize winner (2008) and well known New York Times columnist.
At a certain point, Krugman candidly stated to the utter amazement of the audience that economists do not know the sources of economic growth.
Another Nobel winner (1995), Robert Lucas1, openly confessed his embarrassment when visiting a third-world country and, in the usual audience with the prime minister, he is asked the (also usual) question, “What should I do to increase the pace of my country’s economic growth?”
It was more than three decades ago, in 1987, that Robert Solow won the Nobel Prize for his work on the theory of economic growth and produced a model which explained 37 per cent of the income variance: 10 per cent due to the number of man-hours full-time and 27 per cent to capital stock. And the remaining 63 per cent, Solow defined as the measure of our ignorance.2;3;4;5;6
More recently, in 2018, Paul Romer received a Nobel for complementing Solow’s exogenous sources of growth (man-hours plus capital) with the endogenous cause of the dissemination of knowledge among the population, in terms of R&D, patents, and entrepreneurship.7;8;9
Unfortunately, one has so far been unable to validate the theory with strong empirical evidence10;11. And so, Solow’s “measure of our ignorance” persists to a considerable degree: why are some countries so much more competitive than others?
Of course, both the World Economic Forum12 and
the Institute of Management Development13, among others, have developed competitiveness indexes which relate stronglyA with GDP per capita.
They do, however, have two disadvantages: first, a far-too-long list of more than 100
variables as possible causesB; and second, the possibility of spurious relations between them and the GDP per capita: in the absence of a strong theory which justifies the choice of every single variable, there is the risk that they are both a consequence of third variables, the real causes. C
The quest for the causes of economic growth

In the absence of strong empirical evidence 6;11;14;15;16;17;18;19;20;21, hypotheses abound22;23;24;25 among economists and the general public.
For instance, Francis Fukuyama26, professor at Stanford (and author of the famous The End of History and the Last Man) contends in his book Trust that social virtues are fundamental for the creation of prosperity, as they encourage transactions enabling specialisation to bring all its benefits.
Then, David S. Landes27 from Harvard stresses diversity (as opposed to uniformity) as one of the main sources of growth, and makes the compelling argument that isolation from the exterior and the exclusion of part of the population (e.g., women in some Islamic countries) precludes progress.
Then, the importance of location, natural resources, and climate are general public beliefs which lack a strong basis.
The decisive importance of location must be cast aside when one thinks of, for example, Iceland and New Zealand, which rank as the 15th and 34th wealthiest countries in the world, respectively.
Natural resources (with the exception of very small and oil-rich countries such as Qatar, Brunei, or the United Arab Emirates) must also be put aside if one compares the ranking of Chile (whose only outstanding natural resource is copper) versus Brazil (9th world oil producer, 13th in gold, 4th in wood, etc.), as they nevertheless rank 61st and 85th respectively in GDP per capita in the world. The same is true if one considers Switzerland, which is the 8th-richest country in the world.
And neither can climate be a fundamental cause of growth when Singapore’s average annual temperature during the day is 32°C and Taiwan’s is 22°C, with summers being brutally hot and humid, while their world ranking in GDP per capita is 3rd and 16th respectively.
Thus the question remains, why do some countries grow while others are left behind? Why are some able to offer world-treasured brands and others nothing outstanding?
What if countries were companies?

The answer to competitiveness in the case of a company is straightforward: the quality of its business administration areas: strategy, marketing, human resources, R&D, operations, general management (organisation, control and coordination mechanisms), and the back office (finance, accounting, etc.).
And so, the question arises: since many multinationals are far larger than countries in terms of sales, such as Walmart ($559bn), State Grid ($387bn), Amazon ($386bn), Apple ($275bn), Toyota ($257bn), or Volkswagen ($254bn), why not look at countries as corporations, where the government plays the role of the headquarters and the economic sectors that of divisions or departments of diversified firms?
In such a case, a country’s competitiveness would still depend on the quality of its business administration areas: strategy, marketing, human resources, operations, R&D, etc., which would explain differences in income per capita, a statistic directly supplied by the World Bank.
And to test such a hypothesis, three things are needed.
The first is a way to measure a country’s quality on the several business areas. Second is a large enough sample, in terms of both countries and years. And finally, we require a numerical analysis solid enough to pass the most important statistical tests.
Operationalising the business administration areas
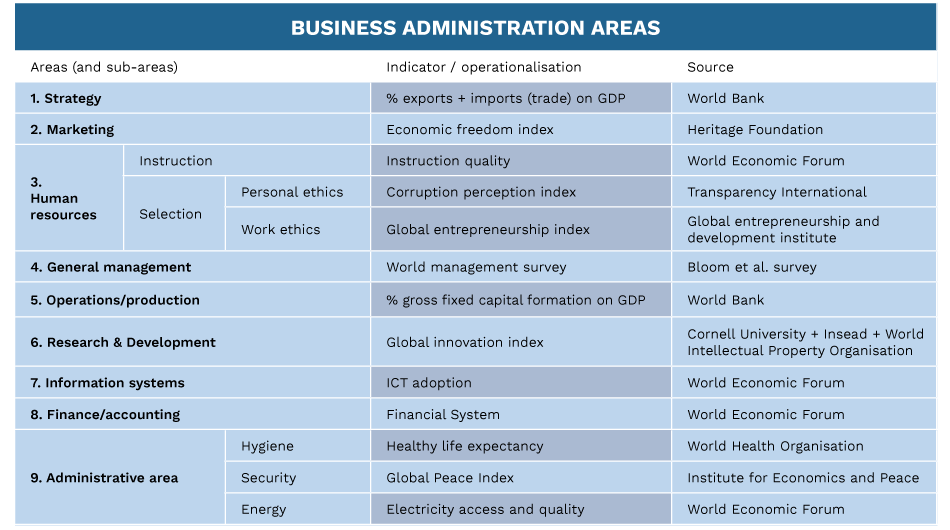
Strategy is the decision of where to compete28 and concerns the choice of geographical areas, industries, and segments chosen according to three criteria: 1) attractiveness (rate of growth, margin and sales volume); 2) synergy; and 3) competitiveness (when a company’s strengths match the market key success factors – e.g., image in luxury brands, reliability in public works machinery, since any malfunction delays all work in the surrounding area, etc.).29
If a country’s economy is completely closed to trade, its inhabitants are condemned to buy national goods regardless of their price and quality. Of their competitiveness.
However, when a country is open to foreign trade, consumers can and will buy goods, regardless of their origin, and only if they are competitive.
Thus, the larger the weight of trade (exports plus imports) in a country’s GDP, the more competitive a country must be, so that openness can be used as an indicator of competitiveness, one of the criteria for evaluating the quality of a strategy30;31;32 (statistic supplied by the World Bank).
Marketing (pricing, advertising, sales promotion, etc.) enables companies to attract consumers. But when monopolies, oligopolies, or firms with great market power prevail, marketing is much less necessary, as clients lack freedom of choice, the alternative being not to buy the product at all, something very hard when the good is of basic, first necessity.
So, the greater the economic freedomD in a country (an index developed by the non-governmental organisationE Heritage Foundation), the better the marketing of its companies has to be.
Within human resources management, two areas are always paramount: 1) instruction (measured by the variables of quality and enrolment level of primary and higher education and training of the World Economic Forum) and 2) selection.
And here, two characteristics stand out: personal ethics (the absence of character is destructive in organisations) and work ethics (effort, willingness to assume responsibility, spirit of initiative, openness to new ideas, etc.), which are translated into the attitudeF towards the work.
Personal ethics (character) was operationalised by the corruption perception index of the NGO Transparency International, and work ethics by the global entrepreneurship index (of the NGO Global Entrepreneurship and Development Institute), which evaluates risk acceptance, networking, opportunity perception, etc.
General management (organisation chart, objectives setting, control and coordination) is measured by the world management survey, a study by Bloom
et al.33), operations by gross fixed capital formation as a percentage of GDPG, and the quality of the R&D department by the global innovation index, created by a joint venture among the Cornell and Insead universities and the World Intellectual Property Organisation.
The quality of information systems management and finance and accounting were supplied by the World Economic Forum survey and the administrative area, which includes hygiene, was operationalised by the healthy life expectancy according to the World Health Organisation, energy by the respective variable of the World Economic Forum, and security by the global peace index of the NGO Institute for Economics and Peace.
Figure 1 presents the nine business administration areas, from strategy to the back office, how they were operationalised (measured), and the source of information (statistical data from official sources, indexes produced by NGOs or academic surveys).
The sample
The collection of information involved three aspects: countries, years, and lag time.
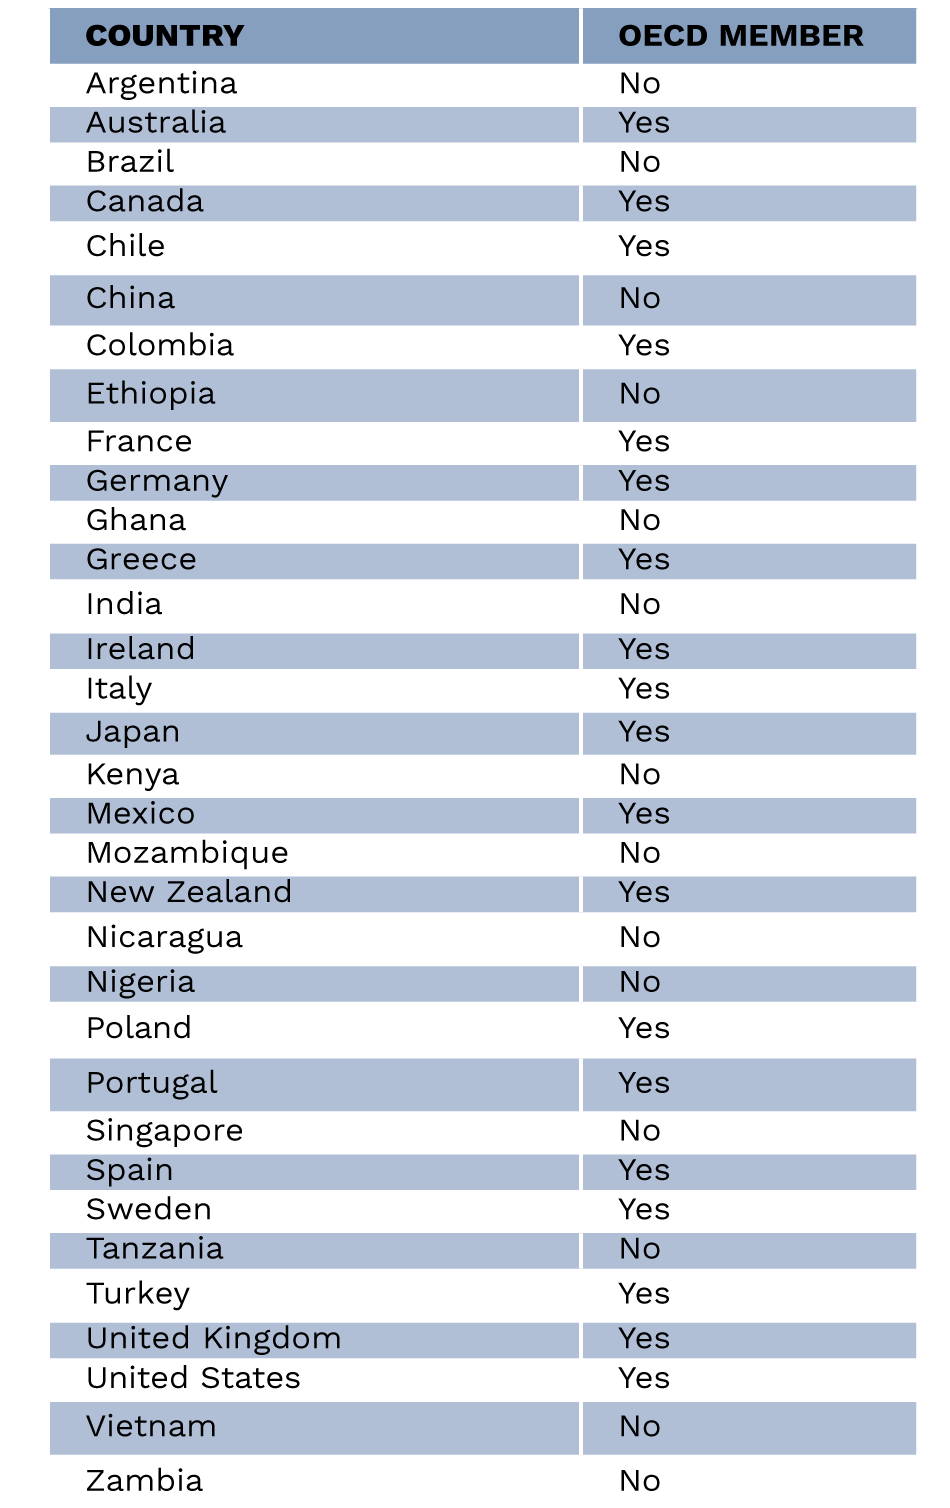
To allow for a cross-sectional, multicultural analysis, the 33 countries of figure 2 were selected as they 1) vary in wealth (some are OECD members, others not, such as Nicaragua or Nigeria) and 2) there is available data for them to measure the quality of the nine business administration areas (for instance, all countries were included in the world management survey by Bloom et al.)33.
To strengthen the analysis, chronological data from several years was used: the years between the end of the sub-prime and the beginning of the COVID crisis were selected.
Finally, to reinforce causality, there is a lag time in the data years: the years of the independent variables of business administration areas precede the dependent variable of national income per capita by one year.
Consequently, data was collected for the years 2014 to 2018 for the business administration areas and 2015 to 2019 for national income per capita. With five years and 33 countries (figure 2), there is a total of 165 observation points.
The Regression analysis

The statistical analysis involved three sequential steps.
First, the Lasso technique34 was performed to reduce multicollinearity in the data, that is, the (cor)relation among the independent variables, as countries which rated best in, for example, strategy tended also to excel in, say, marketing, operations, or R&D.
The second step was to apply the ordinary least squares technique to the retaining six business areas, namely: 1) strategy; 2) general management; 3) marketing; 4) human resources (training, work and personal ethics); 5) information systems; and 6) R&D.
Finally, several tests were performed to assess the adequacy of the statistical analysis, and these included:
- Whether a linear model could be used;
- Whether the model was homoscedastic;
- The absence of autocorrelation of residuals;
- The normal distribution of the residuals; and
- The absence of multicollinearity.
Basically, the statistical analysis is compliant with all tests, except multicollinearity. This means that, in spite of the Lasso technique, some degree of (cor)relation remains among the independent variables. This will be discussed in the next section.
The results
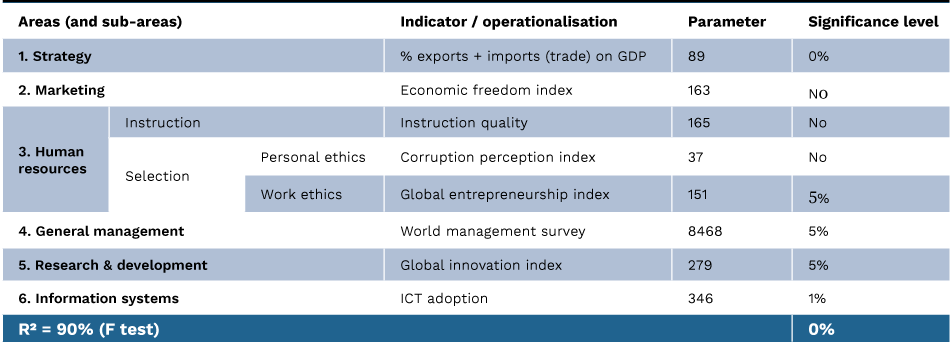
Figure 3 (next page) indicates the parameters of all variables, that is, their impact on national income per capita. As expected, all of them are positive (signalling a positive impact of a country’s business administration areas on economic growth) and five out of eight are statistically significant to at least a 5 per cent level (indicating a very low probability that the parameter values are due to chance).
The presence of multicollinearity affects the confidence in the value of each variable parameter, although it does not affect the reliability of the overall prediction of the model.
Furthermore, multicollinearity is something to be expected, as better firms tend to have higher quality in several business administration areas and not only in a few.
The competitiveness of Toyota, Amazon, or Apple is not due solely to its marketing, but also to the quality of its manufacturing, excellence in human resources management, and so forth. The best firms tend to excel in most (if not all) business areas.
And the most important of all results obtained is the R2 of 90 per cent of the regression model (and statistically significant at 0 per cent level).
This means that only 10 per cent of the variance in income per capita among 33 countries in figure 2 (from Argentina and Australia to Vietnam and Zambia) during the homogenous five years period in between the (end of the) sub-prime crisis and the (beginning of the) COVID crisis year of 2020 is not explained by the quality of those countries’ firms in the business areas of 1) strategy, 2) marketing, 3) human resources (instruction + personal ethics + work ethics), 4) general management (organisation control and coordination mechanisms), 5) R&D, and 6) information systems.
The high income per capita variance explained (90 per cent) and the sparsity in the number of explaining variables (six) and the theory which led to their choice (countries seen as diversified companies) constitute a considerable improvement on previous empirical evidence of both the academic works analysed in the beginning of the article and on indexes such as those of the World Economic Forum or the Institute for Management Development, which use hundreds of variables in opposition to the theory of this article: competitiveness depends on the quality of a country’s business administration areas.H
Conclusion
Economists have for long discussed the sources of economic growth, with divergence fuelled by the lack of strong and decisive empirical evidence.
However, in the area of business administration, there is a far larger consensus. The paradigm here is that a firm’s competitiveness is a function of the quality of its business areas: 1) strategy, 2) marketing, 3) human resources, 4) general management, 5) operations, 6) R&D, 7) information systems, 8) finance and accounting, and 9) administrative area (hygiene, security, energy).
The fact that many multinationals (from the United Health group to Volkswagen) are larger than countries raises the question: what if one considers countries as large diversified companies, whose competitiveness depends on the quality of their business administration areas?
Under this perspective and evaluating the business functions with official data (e.g., from the World Bank) in some instances, and indexes by NGOs (e.g., the Global Entrepreneurship and Development Institute) in others, or academic surveys (Bloom et al.) on still others, one is able to explain 90 per cent of the income variance among 33 countries (from Argentina to Brazil, to Canada, etc. in figure 2) during the five-year period between the end of the sub-prime crisis and the start of the COVID recession.
As a general conclusion, one can thus say that the results bring a new meaning to the statement of Peter Drucker, founder of modern management, that there are no underdeveloped countries, only under-managed ones.
This article was originally published on 4 October 2023.
About the Authors
 Jorge Sá is a senior research fellow at Drucker University (Peter F. Drucker and Masatoshi-Ito Graduate School of Management) in Los Angeles, and a professor at ISG Business School.
He is an expert on Peter Drucker and Philip Kotler, founders of modern management and modern marketing, respectively, with whom he studied and who offered letters of recommendation for his books and endorsements for his work. Has a master’s degree from the Peter F. Drucker Graduate School of Management in California and a doctorate (PhD) in Business Administration from Columbia University, where he was a student and research and teaching assistant. Was awarded the Jean Monnet Chair by the Jean Monnet Foundation in Brussels and has published books in twelve languages.
 Paulo Rodrigues has a bachelor and master’s degree in economics from ISCTE Business School.
Paulo Rodrigues is currently working at Bank of Portugal, but in the meantime had the opportunity to collaborate in research projects with Professor Jorge Sá on exploring economic growth determinants.
Referemces/Bibliography
- Robert E. Lucas Jr., “On the Mechanics of Economic Development”, Journal of Monetary Economics 22, no. I (1988): pp. 3-42
- Robert M. Solow, “Growth Theory: an exposition”, Oxford Clarendon Press (1970)
- Robert M. Solow, “A Contribution to the Theory of Economic Growth”, The Quarterly Journal of Economics, vol. 70, no. 1 (1956): pp. 65-94
- Robert M. Solow, “Applying Growth Theory across Countries”, The World Bank Economic Review, vol. 15, no. 2 (2001): pp. 283-8
- Robert M. Solow, “Technical Change and the Aggregate Production Function”, The Review of Economics and Statistics, vol. 39, no. 3, The MIT Press (1957): pp. 312–20
- Robert M. Solow, “Capital Theory and the Rate of Return”, North-Holland Publishing Company (1963)
- Paul M. Romer, “Dynamic competitive equilibria with externalities, increasing returns and unbounded growth” (PhD), The University of Chicago (1983)
- Paul M. Romer, “Increasing returns and long-run growth”, Journal of Political Economy, vol. 94, no. 5 (1986): pp. 1002-37
- Paul M. Romer, “Economic Growth”, The Concise Encyclopedia of Economics, Indianapolis, Ind., Liberty Fund (2008)
- Paul M. Romer, “The Deep Structure of Economic Growth”, https://paulromer.net/deep_structure_growth/ (2019)
- Paul M. Romer, “Human capital and growth: Theory and evidence”, Carnegie-Rochester Conference Series on Public Policy, vol. 32 (1990): pp. 251-86,
- Global Competitiveness Report, World Economic Forum
- World Competitiveness Yearbook, Institute for Management Development
- N. Gregory Mankiw, David Romer, David N. Weil, “A contribution to the empirics of economic growth”, The Quarterly Journal of Economics, vol. 107, Issue 2 (1992): pp. 407–37
- Kevin B. Grier, Gordon Tullock, “An empirical analysis of cross-national economic growth, 1951–1980”, Journal of Monetary Economics, vol. 24, issue 2, (1989): pp. 259-76
- Shujin Zhu, Renyu Li, “Economic complexity, human capital and economic growth: empirical research based on cross-country panel data”, Applied Economics, vol. 49, no. 38 (2017): pp. 3815-28
- Robert J. Barro, “Determinants of Economic Growth: A Cross-Country Empirical Study,” NBER Working Paper 5698, National Bureau of Economic Research (1996)
- Rostam M. Kavoussi, “Export Expansion and Economic Growth – further empirical evidence”, Journal of Development Economica, 14 (1984): 241-50
- Chandrashekar Raghutla, “The effect of trade openness on economic growth: Some empirical evidence from emerging market economies”, Journal of Public Affairs, 20, e2081 (2020).
- Jess Benhabib, Mark M. Spiegel, “The role of human capital in economic development evidence from aggregate cross-country data”, Journal of Monetary Economics, vol. 34, issue 2 (1994): pp. 143-73,
- David Romer, David Weil, “The Empirics of Economic Growth”, Quarterly Journal of Economics, 107 (1992): pp. 407-38.
- David Renelt, “Economic Growth: a review of the theoretical and empirical literature”, Policy Research Working Paper Series, The World Bank, no. 678 (1991).
- Claude Diebolt, Marielle Monteils, “The new growth theories: a survey of theoretical and empirical contributions”, Historical Social Research, 25(2), (2000): pp. 3-22
- Ahmet Gülmez, Furkan Beşel, “Economic Growth – Theory and Practice”, Cambridge Scholars Publishing (2018)
- Erich Gundlach, “Solow vs. Solow: notes on identification and interpretation in the empirics of growth and development”, Review of World Economics, 141 (2005): pp, 541–56
- Francis Fukuyama, “Trust: The Social Virtues and the Creation of Prosperity”, Free Press (1995)
- David S. Landes, “The Wealth and Poverty of Nations: Why Some Are So Rich and Some So Poor”, Little, Brown and Company (1995)
- Jorge V. Sá, “The War Lords: measuring strategy and tactics for competitive advantage in business”, Kogan Page (1999)
- Jorge V. Sá, “Strategy Moves: 14 Complete Attack and Defence Strategies for Competitive Advantage”, Prentice-Hall / Financial Times (2005)
- Satish C. Sharma, Priti Gupta, Ravi Gupta, “A comparative analysis of the benefits of free trade agreements on FDI, between developed countries and developing countries”, International Journal of Management (IJM), vol. 11, issue 12 (2020): pp. 1841-52
- Denise H. Froning, “The benefits of free trade: a guide for policymakers”, The Heritage Foundation Backgrounder, no. 1391, (2000)
- Gino Gancia, Giacomo A.M. Ponzetto, Jaume Ventura, “A theory of economic unions”, Journal of Monetary Economics, vol. 109 (2020): pp. 107-27
- Nicholas Bloom, Raffaella Sadun, John M. Van Reenen, “Management as a Technology?”, Harvard Business School Strategy Unit Working Paper No. 16-133, Stanford University Graduate School of Business Research Paper No. 16-27 (2017)
- Trevor Hastie, Robert Tibshirani, Martin Wainwright, “Statistical Learning with Sparsity: The Lasso and Generalisations”, Chapman & Hall/CRC (2015).
Endnotes
- In both cases the correlation coefficient is close to 0.9.
- The latest IMD index uses 334 variables grouped in 20 pillars (sub-factors). However the total number of variables of the index has changed over time.
- Empirical research on the sources of economic growth can be divided into three categories.
First, Solow’s groundbreaking and Nobel-winning work in 19636, which using as a sample USA data of the years 1929-1957 and with capital and man-hours as independent variables, explained 37 per cent of the GNP absolute (not per capita) variance.
Second, there is Paul Romer, another Nobel winner11, who under his endogenous theory explains a higher variance of GDP per capita: 58 per cent. It includes as an independent variable 1960 GNP per capita for the sample countries, assuming decreasing marginal productivity of capital.
A third category of empirical studies includes G. Mankiw et al.14, K.B. Grier et al.15, S. Zhu et al.16, R. Barro17 and R. Kavoussi18.
But all these studies have one or more of the following drawbacks: not using GDP per capita of the total population as dependent variable; and / or low R2; and / or small samples; and / or unclear theory underlying the choice of independent variables. - The degree of economic freedom in a country depends on three factors: 1) the level of taxation (which is coercive); 2) the presence of the state in the economy (which allows for no competition); and 3) the intensity of competition on the private markets (few oligopolies, etc.), of which the last is of interest to us.
- Henceforth NGO.
- Attitude has been defined as a small thing which makes a great difference (Winston Churchill).
- The source is the World Bank.
- The latter Institute for Management Development index has 334 variables.