Breakout trading is one of the most popular forms of trading in financial markets. Combined with solid risk management, it’s a simple strategy that allows an investor to generate potential life-changing returns.
Breakout traders look for periods of consolidation and points of support and resistance. Then, when the stock price breaks out of that consolidation or support/resistance, the breakout trader pounces.
In this article, we’ll show you how to spot high momentum stocks before they breakout. We’ll also show you how to trade them once they break, as well as how to manage risk during the trade. By the end of this article, you’ll have a better understanding of breakout trading, spotting high momentum stocks before the breakout, and risk management principles to protect your capital.
Let’s get after it!
What Is A Stock Breakout?
Put simply; a stock breakout is when the price of a stock breaks through a point of consolidation or congestion on the price charts. For example, say stock XYZ has traded up to $10/share three separate times in the last few weeks. Yet, for some reason, the stock can’t break past $10. That’s called resistance—the price which the stock failed to break through after multiple attempts.
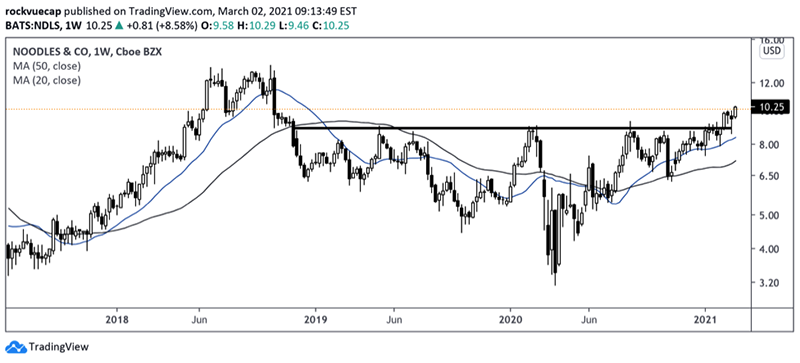
Let’s use Noodles & Co. (NDLS) as a visual example (see below):

You can see the stock’s tried to break above the $8.88 price point almost ten times! That’s some severe resistance. But when it does, notice it practically immediately trades into new high ground.
Understanding what a stock breakout looks like on a price chart allows us to spot potential breakouts as they happen!
How To Identify A Breakout When It Happens
In general, the stock market is efficient most of the time. However, there are periods when buyers outweigh sellers and sellers outweigh buyers. Stocks move on supply and demand. The more people want a stock, the higher its price. The more people want to sell a stock (i.e., don’t want it), the lower its price.
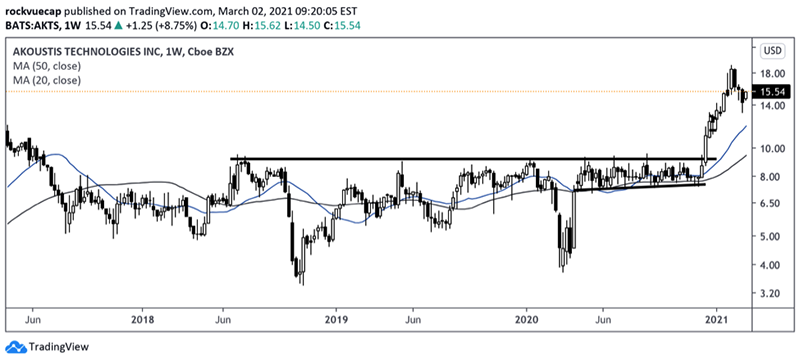
Thanks to price charts, we can easily spot these supply/demand dislocations in real-time! Let’s use another example from Akoustis Technologies (AKTS):

Like NDLS before, we can see the period where sellers outweigh buyers at ~$9.25/share. Again, we call that price resistance. But notice what happens in mid-December. See that big, white breakout bar? That’s when buyers outweigh sellers, and we have a shift in the supply/demand equation.
At that moment, there are more buyers than sellers, which drives the stock price higher. The stock rocketed from $10/share to >$18/share in a few short weeks.
That’s how we identify a breakout when it happens: we look for a level of resistance and wait for the stock price to break through that resistance with strength.
Now you’re probably wondering, “how can I tell if a stock is breaking out on strength or not?” Excellent question. The way we determine, that is through volume.
A stock’s volume is the average frequency at which people trade the stock. Think of it like going to the grocery store. If you buy two bags of bagels every week, your average volume for “trading” bagels is ~2 bags.
Now, what if your grocery store released a brand new bagel flavor that you’re dying to try? You rush to the store and buy six bags of unique taste. Those six bags are a spike in volume. Stocks work the same way.
If a stock trades typically 100K shares daily, then on a breakout day exchanges 1M shares, it’s breaking out on strength.
How To Manage A Breakout Trade
Alright, you found resistance, waited for a breakout, and placed your buy order on substantial above-average volume. Now you have to manage the trade.
Breakout trading is about managing risk and losing the least amount of money possible. To do this, you should place a stop-loss order at the low of the previous day’s close. The last day’s close usually coincides with the candle right before the breakout.
Never risk more than 1% of your capital on a given trade. A 1% loss rule allows you to take many losing trades and still come out ahead.
Most importantly, once you place your stop-loss, the only direction you can move it is in favor of your trade. Never carry your stop-loss lower because you’re afraid of exiting for a loss. Take the loss and try again.
Breakout Trading: Other Considerations
Before you start trading breakouts, there are a few things you should know. First, the best breakouts are ones that break into new highs (all time, 52-week, etc.). These stocks have no selling pressure from buyers at previously higher prices.
Second, ensure that the general stock market is in an uptrend before buying upside breakout trades. You want the rising tide to lift all ships, including your stocks. Buying breakouts while the market is in a downtrend leads to frequent losses and failed breakouts.
Finally, don’t get greedy and stay patient with your process. You will suffer drawdowns — periods when you have a streak of losing trades. A drawdown is a natural function of a breakout trading system. Don’t fear losses, respect losses. Learn from them. Remember, if you risk a 1% max on any one trade, you need 100 consecutive losing trades to destroy capital. Focus on the process.
Disclaimer: This article contains sponsored marketing content. It is intended for promotional purposes and should not be considered as an endorsement or recommendation by our website. Readers are encouraged to conduct their own research and exercise their own judgment before making any decisions based on the information provided in this article.


![“Does Everyone Hear Me OK?”: How to Lead Virtual Teams Effectively iStock-1438575049 (1) [Converted]](https://www.europeanbusinessreview.com/wp-content/uploads/2024/11/iStock-1438575049-1-Converted-100x70.jpg)


