


By Sunil Gupta
Google Flu Trends article of November 2008 heralded in a new age for big data where where it is possible to leverage the vast amount of data to speak for itself, without theory or expert knowledge of the subject matter. However, in a short span, the pendulum swung from big data being a big deal to becoming a big hype. As is usually the case, the truth is somewhere between these two extremes, this article highlights the potential impact of big data on business practices in three broad areas: applications, methods and infrastructure.
In November 2008, researchers at Google published an article in the journal Nature about Google Flu Trends (GFT) – a model that used hundreds of billions of US consumer searches on Google about influenza during the years 2003-2008 to predict the incidence of the flu. Google scientists did not use any prior knowledge of influenza; instead they analysed more than 50 million of the most commonly used search queries to automatically select the best-fitting search terms by estimating 450 million different models. The final model, which used a mere 45 search terms, was used to predict rate of flu in several US regions and these results were compared with the actual incidence of influenza as reported by the Centers for Disease Control (CDC). The paper reported an incredible accuracy rate with correlations between actual and predicted influenza rates between 0.90 and 0.97.1
While proponents of big data had been around for many years before the Google study, this article soon became the poster child for the promise of big data. It came on the heels of a provocative article by Chris Anderson, editor of Wired magazine, who argued that big data heralds a new age where theory and expert knowledge of a subject matter are irrelevant. Google scientists were neither experts in influenza nor did they build any sophisticated theory about the reasons for the propagation of the disease. Instead they leveraged the vast amount of data to “speak” for itself. This emboldened the champions of big data, and soon the popular press and technology blogs were filled with the visions of a new era of big data.
An article in the March 2014 issue of the journal Science sent a serious blow to this hype by reporting that, since August 2011, GFT had overestimated the rate of flu for 100 of the last 108 weeks.2 In some weeks, GFT predictions were almost double the actual incidence of flu. This article opened the floodgates of criticisms about big data and the hype surrounding it. Articles with titles such as “Big data: are we making a big mistake?”3 or “Eight (no, Nine!) Problems with Big Data,”4 now started showing up everywhere.
[ms-protect-content id=”9932″]In a short span, the pendulum seemed to have swung from big data being a big deal to becoming a big hype. Doubts about the business value of big data started emerging. Gartner, a research company, predicted that by 2017 almost 60% of big-data projects would fail to go beyond piloting and experimentation. Wired magazine noted that almost 70% of enterprise project money is spent on aggregating, storing, and optimising data before a single penny of value is created. Companies around the world, which until now were busy collecting and storing vast amounts of data, were beginning to wonder what, if any, insights they could draw from these data.
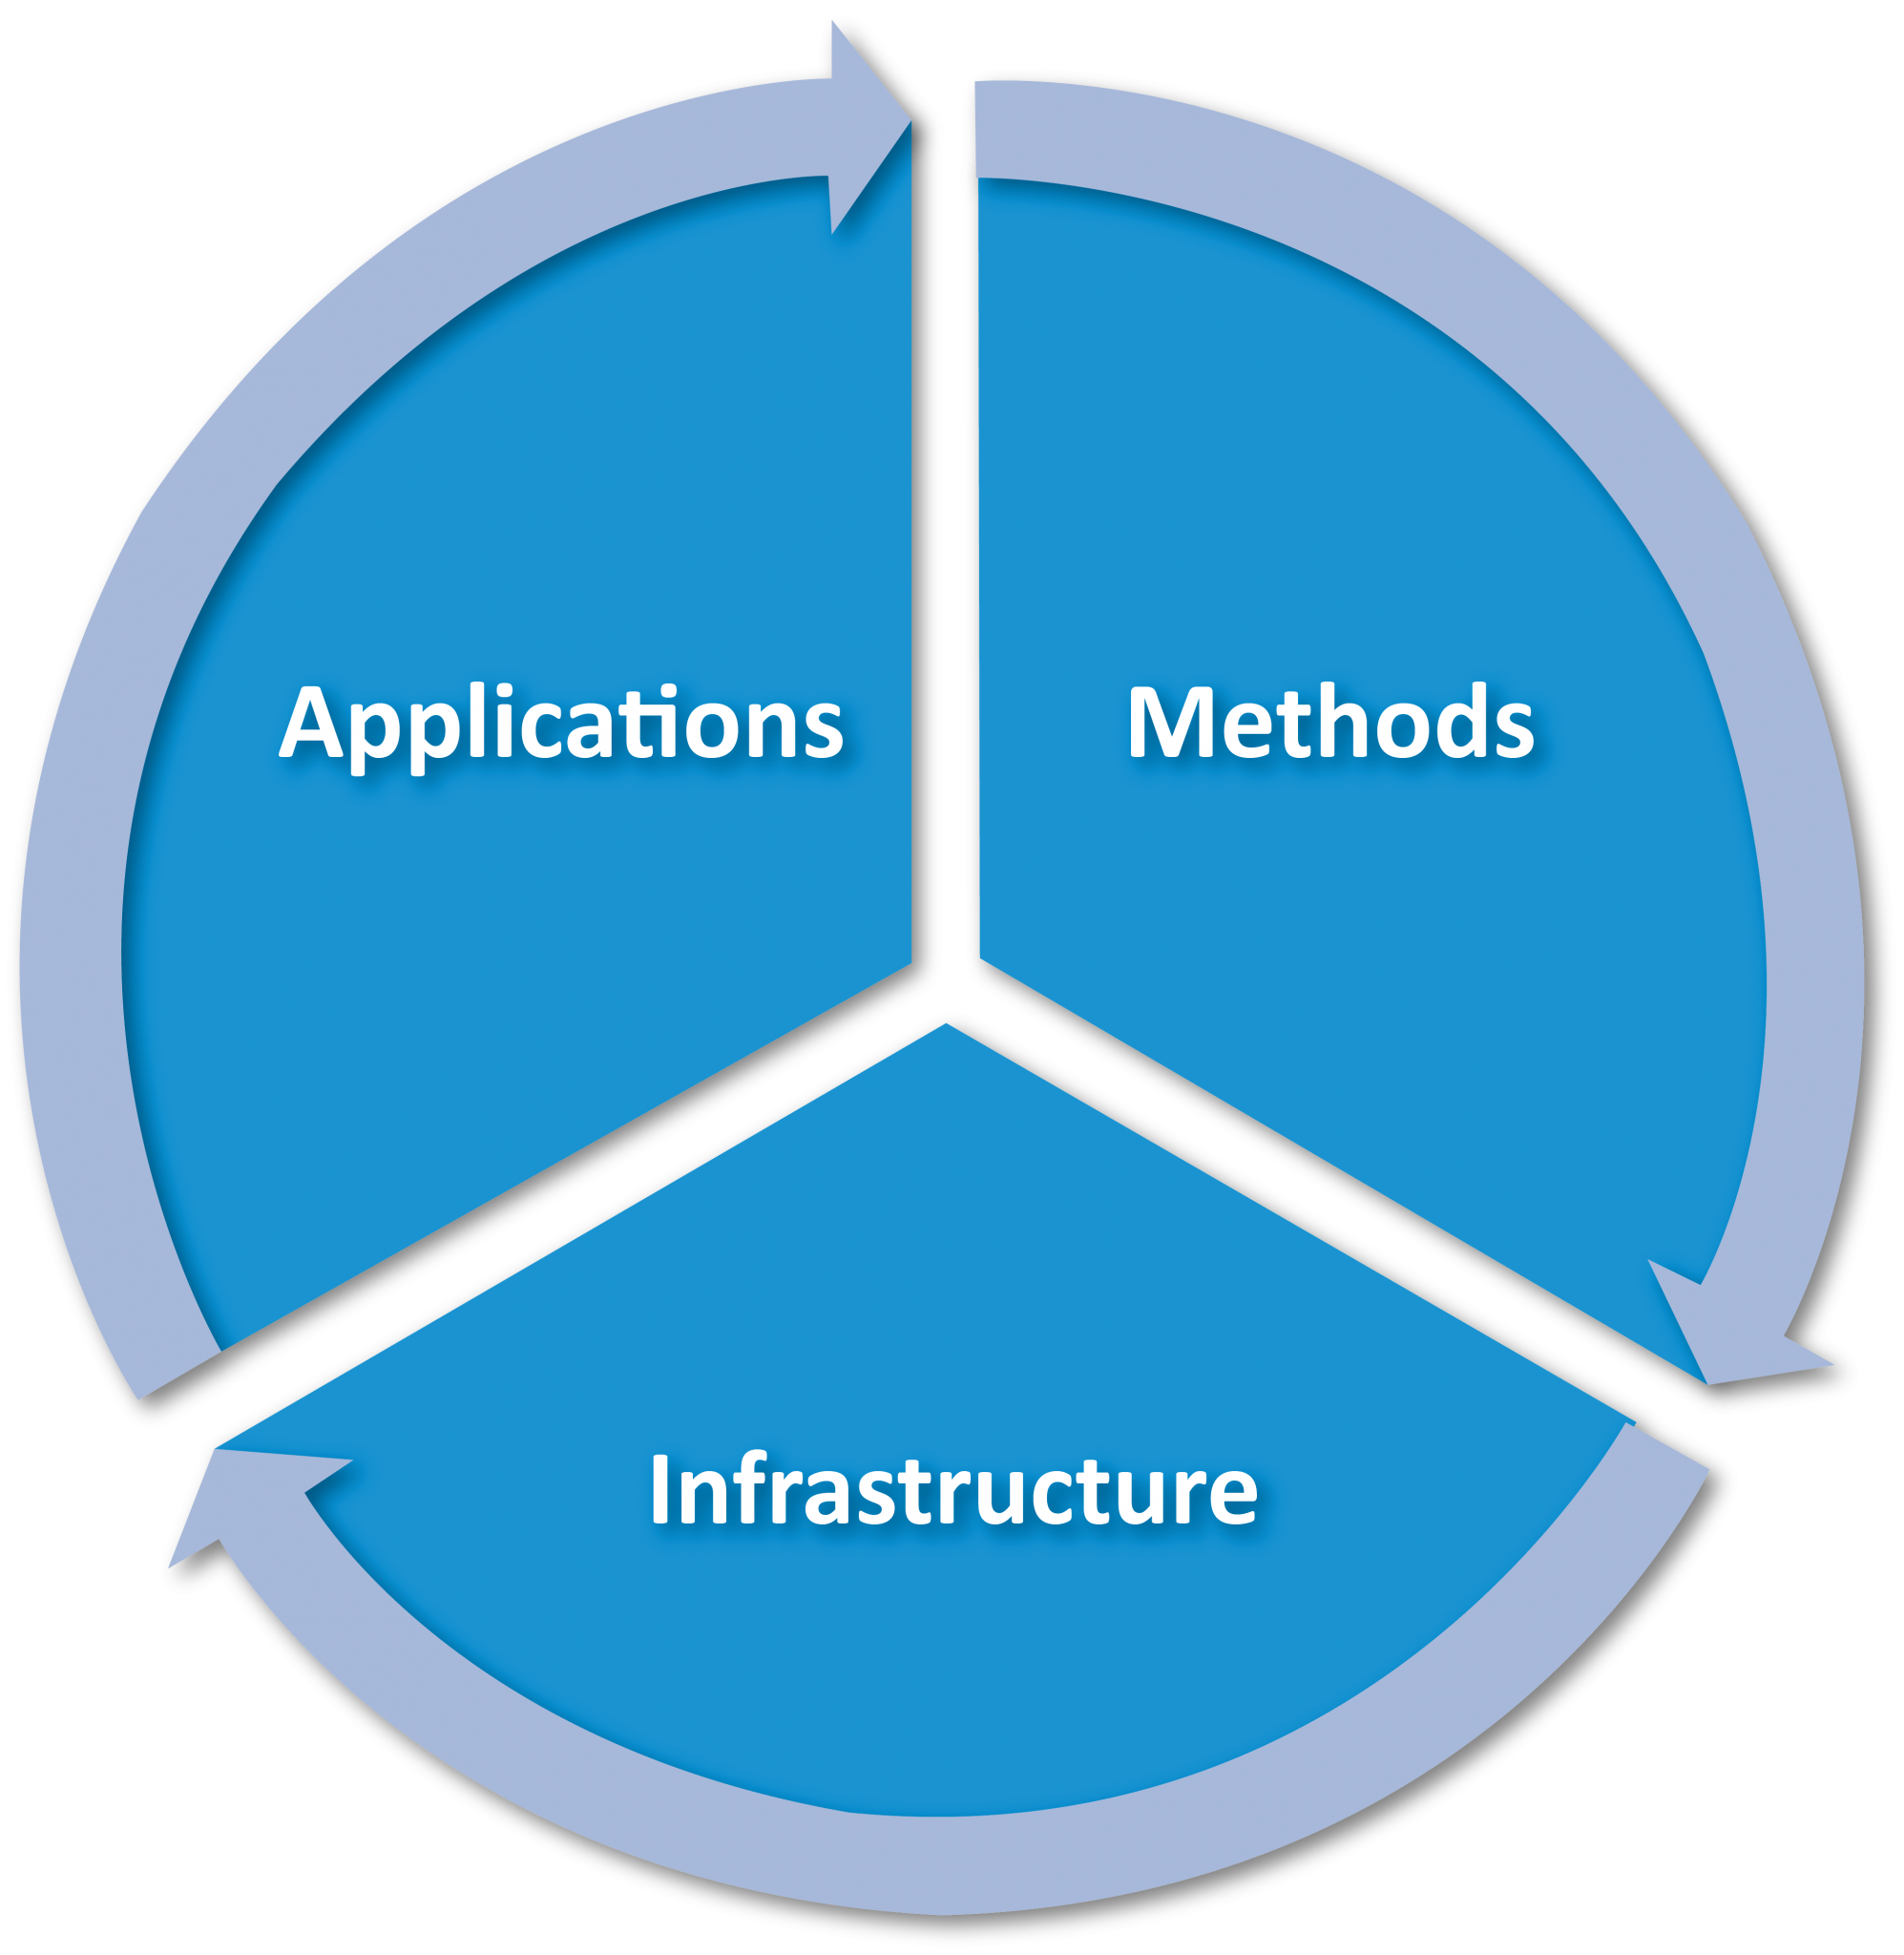
As is usually the case, the truth is somewhere between these two extremes. While some of the claims of big data were clearly hyped, there are indeed invaluable opportunities offered by these data. Instead of focusing on the characteristics of big data (e.g., the so-called 3Vs: volume, variety, and velocity), this article highlights the potential impact of big data on business practices in three broad areas (see Figure-1).
Figure-1: Three Areas of Big Data Impact
Applications
Business applications of big data can be grouped into three categories: doing traditional things better and faster, improving efficiency of business operations, and new applications that were not possible before the arrival of big data.
1. Doing things better and faster
Big data does not have to offer big insights; small increments in current business practices spread over a large customer base can yield significant improvement. Companies can now gather and process information almost instantaneously, called “nowcasting”, which offers unparalleled speed and accuracy. Credit card companies have always used data for fraud detection, but now they can use real-time data to detect fraud faster that could save them billions of dollars. Macy’s, a department store chain, uses real-time demand information for 73 million items to re-price them within an hour.
In the advertising world, small improvements in click-through rates (CTR) of online ads can significantly improve return on investment. One study used consumers’ browsing data to learn, automatically and near optimally, which banner ads to serve to consumers in order to maximize CTR. Data from 100,000 consumers and 450,000 banner ads showed that morphing banner ads almost doubled CTR of ads from 0.17% to 0.31%.5 This seemingly small improvement in CTR can translate into billions of dollars in savings for the advertising industry.
Lending companies, such as LendUp and Kabbage, use traditional financial data along with social media information to gauge credit worthiness of their customers, usually small businesses. Kabbage examines a variety of information about these businesses, including reviews of their customers, to determine their credit worthiness and approve a loan of up to $50,000 within seven minutes.
Bluefin Labs, acquired by Twitter in 2013, links television programming with discussion on social platforms to assess how reach and engagement of television programs or ads is amplified in social media. As more and more consumers use multiple screens simultaneously, this Social TV Analytics provides a better and more complete picture of the impact of a television programme or ad.
2. Improving efficiency
UPS ships almost 16 million packages daily using its fleet of more than 100,000 drivers. Reducing just one mile per driver per day can reduce the company’s cost by $50 million per year. Using telematics sensors on its trucks and a route-optimising programme called ORION (On-Road Integrated Optimisation and Navigation), UPS suggests optimal routes to its drivers within 6-8 seconds. This system has managed to reduce 85 million miles driven per year, which translated into 8 million fewer gallons of fuel used. It also managed to reduce engine idling time by 10 million minutes, which led to a reduction in fuel consumption of about 650,000 gallons.6
Kimberly-Clark Corp., a consumer products giant, is reducing its inventory costs by getting real-time demand data from several retailers. This has allowed the company to improve the accuracy of its inventory forecasts by 20% to 35%, which has led to savings of millions of dollars.7 GE is using sensors in its machines, including jet engines and wind turbines, to collect data and develop a platform called PREDIX, which allows it to do predictive maintenance and improve the efficiency of its machines. Improving airline engine efficiency by 1% resulted in $2 billion in annual savings.8
3. New applications
Data from new and varied sources are making it possible for us to apply them in new domains that were either not possible before or were not thought of as ripe for data driven decisions.
People Analytics
In his famous book Moneyball, Michael Lewis described how Oakland’s baseball team used data analytics to thrive in a field that was dominated by the gut feels of baseball experts. Now more novel and interesting applications of such “people analytics” are emerging. Knack, a startup in Silicon Valley, makes app-based video games like Dungeon Scrawl and Wasabi Waiter. By asking employees to play these games for 20 minutes, it gathers an enormous amount of data on which actions a person takes, the sequence of these actions, and whether or not he or she hesitates before taking an action. These data are then used to analyse a person’s creativity, persistence, and ability to prioritize and learn from mistakes.
New Business Opportunities
The Weather Channel reinvented itself by finding new and interesting applications of its data. In early 2013, the company launched the WeatherFX division, which analysed microclimates for 500,000 locations worldwide, and started connecting weather data with data on consumer purchases to predict their behavior based on weather-sentiment analysis, or how weather makes people feel in a particular location at a particular time. One of the first brands to use WeatherFX was Pantene, which targeted Pantene promotions by weather in a zip code – if hot and humid show Pantene Smooth, if low humidity, show volumizer. Sales of Pantene’s advertised products jumped 28%.
MasterCard offers its commercial clients a service called SpendingPulse, which captures near real-time purchase data from billions of transactions around the world to provide a holistic picture of the economy and to predict trends in a variety of industries.
Leading Economic Indicators
Consumer web searches continue to serve as leading economic indicators in many areas. Israel’s central bank analyses Google search keywords to gauge consumer demand before releasing government statistics. Popularity of the search term JSA (for job seekers allowance) helped predict unemployment for Bank of England. Travel related search allowed the Bank of Spain to predict tourism, while mortgage-refinancing search helped predict New York Fed refinance applications. Under the new Prime Minister Shinzo Abe, Japan is also looking at Big Data for timely economic indicators.
Social Impact
New forms of data also have the potential to significantly impact and improve social programmes. United Nations started a new initiative, Global Pulse, which identifies problems that could be addressed through real-time monitoring of digital data. Examples of its research include using mobile phone data to estimate food security, using social media for remote monitoring and detection of HIV in Brazil, and nowcasting food prices in Indonesia using social media signals.9
To achieve financial inclusion for their poorest citizens, governments around the world are using biometrics and big data to create identity, digitally pay government grants, and provide access to financial services such as insurance to billions of people around the world. India started its unique ID programme called Aadhaar in 2009, and by January 2015 it has been successfully issued to more than 734 million people. Nigeria and South Africa started a similar programme to create a national ID in partnership with MasterCard.10
Governments are beginning to use big data to build smart cities. London is currently working with Bologna, Genoa, and Barcelona as part of the EU’s iCity programme to develop an urban platform for testing the sourcing, capture, and storage of the different types of public and private data, which will be collected from millions of devices across smart cities. These data would be used for managing congestion, saving energy, public safety, and many other applications.
Methods
Scientists and data analysts are used to working with samples of data to build sophisticated models to test theories and predict future behavior. While some of these methods will continue to be useful, big data requires different thinking for how models are constructed.
1. Data visualisation
Perhaps the simplest and most powerful way to generate insights from large amounts of data is through visualisation. One of the famous examples of data visualisation comes from the 1854 cholera outbreak in London. During that time, poor air quality was believed to spread diseases such as cholera and bubonic plague. John Snow, a physician, was skeptical of this theory, and instead of creating a complex model or a new theory to uncover the cause of cholera outbreak in London; he simply created a dot map to identify the cluster of patients on a London map. He soon realised that majority of the cholera deaths occurred around a public water pump on Broad Street, which later turned out to be the real cause of this outbreak.
Procter and Gamble (P&G) has institutionalised data visualisation as a primary tool for decision making by creating decision cockpits, which visually display the key information on desktops. Senior management meetings are held in specially built meeting spaces, called Business Spheres, which are outfitted with large screens that display key data for the sales of its major products around the globe. Executives can drill down on the data at any level of detail in real time to make quick decisions. This approach has made decision making faster, easier, and fact based at P&G.11
Ayasdi, a DARPA-funded spinout, uses topological data analysis to produce 3-D visual maps to uncover patterns in data. Its work has revealed genetic traits of cancer survivors, tracked the source of an E. coli outbreak, and provided insights about terrorist behavior in and around Baghdad. Tableau, a software company, provides simple drag and drop tools for people of any skills to create maps and graphs that offer quick and deep insights from large amounts of data.
2. Explore and discover
John Tukey, one of the most celebrated statisticians of our times, was a firm believer in the power of exploratory data analysis. Tukey’s ideas are even more relevant today when data from a variety of sources offers new and rich patterns. Most data now comes in unstructured form such as videos, images, and social media discussions. To make sense of these data we need methods that not only anticipate every possible action, but also learn and adapt to the new information.
IBM’s Watson system and its cognitive computing approach are built on the idea of exploring, discovering, and learning over time. Unlike the expert systems of the past where rules are hard coded, cognitive computing is based on artificial intelligence and machine learning that allows it to process natural language and unstructured data to learn a domain and adapt like humans. Instead of simply confirming current hypotheses and theories, the system can generate new hypotheses as it learns and adapts with the new patterns in the data.
3. Simple models
As the scientific disciplines progress, there is a tendency for scholars and data scientists to make the models more complex. In a 2000 paper titled, “How complicated does the model have to be?” Paul Krugman, a Nobel Laureate in economics, wrote that modern-day complex models of macroeconomics are neither more accurate nor more insightful than the simpler models used decades ago.12
In 2000, two Microsoft researchers compared four algorithms on how to improve grammar in Word documents with 10 million, 100 million and 1 billion words. With more data performance of all algorithms improved, but a simple algorithm that was the worst performer with half a million words performed the best.13
Diversity over Complexity
Why do simple models with large data beat complex models? While this is still an ongoing area of research, some insight in this topic comes from research on the combination of forecasts. In a seminal paper published in 1969, Bates and Granger showed that combining a pair of forecasts can produce a better forecast, an idea similar to financial portfolio optimisation. Later studies by Clemen, Winkler, and others confirmed this idea to show that simple averaging of various forecasts produces a far superior forecast than any single method.
More recently, statisticians have developed a classification method called random forest that combines several simple decision trees to classify and predict a phenomenon. Each tree is able to capture a unique aspect of the data and, by combining several simple but different trees; the algorithm is able to capture all the nuances of the data.
One of the most celebrated examples of this idea comes from the Netflix competition. In October 2006, Netflix announced a competition, with a $1 million prize, for anyone who could help improve its movie recommendation algorithm. During its award ceremony in 2009, Netflix’s chief product officer described the key learning from this competition:
“At first, a whole lot of teams got in — and they got 6-percent improvement, 7-percent improvement, 8-percent improvement, and then it started slowing down… Then there was a great insight among some of the teams — that if they combined their approaches, they actually got better.”14
The more diverse and different the approaches, the more value they added when combined with an existing algorithm. Joe Still of the Ensemble, the team that finished second in this contest, reflected on his experience and said, “One of the big lessons was developing diverse models that captured distinct effects even if they’re very small effects.”15
4. Experiments
Digital technology enables companies to do large-scale field experiments in real time. Experiments have been used to examine how changes in price affect demand, the impact of advertising on sales, the diffusion of information, social influence on voting behavior, and the transfer of moods among friends in a social network.
To determine the impact of advertising on offline sales of a retailer, Facebook conducts field experiments instead of building complex models. First, it links a retailer’s customer database with their Facebook accounts. Next, a randomly selected set of customers is exposed to the retailer’s ads on Facebook while others are exposed to controls ads. Finally, the customers’ actual purchase behavior in offline stores is monitored to determine the impact of Facebook advertising.
To understand what makes a song, movie, or a book a hit, Salganik, Dodds, and Watts created an artificial music market where more than 14,000 participants were asked to listen to songs and rate them on a 1-5 scale. The study showed that the number of times a song was downloaded by others (a number that was manipulated by the researchers) had a huge impact on the participants’ likability of a song. In other words, social influence, and not the quality of a song or a movie, largely determines their success.16
Infrastructure
Traditional databases, such as those offered by Oracle, store information in rows and columns on servers and use query languages such as SQL to retrieve this information. As datasets get large and include unstructured information that does not neatly fit into rows and columns format, this type of database becomes less useful.
Based on research papers published by Google in 2003-2004, a programmer at Yahoo created a new open-source software framework called Hadoop, named after his son’s toy elephant. Hadoop comprises two things: a distributed file system that splits files into large blocks that allow it to store this information across a network of thousands of cheap computers, making it less costly and scalable; and a data-processing system called MapReduce that accesses data from multiple locations and processes it in parallel.
Soon, several companies such as Cloudera, MapR, and Hortonworks started using Hadoop – many of them by building proprietary accessories to the open-source version of the original software system. However, one of the key problems with Hadoop is that it crunches data in a “batch,” which makes it slow for real-time data access and analysis. To overcome this problem, a host of new systems have emerged, such as Dremel by Google, Impala by Cloudera, and Drill by MapR. One of the fastest systems to come up in the market is from Databricks, a startup spun out of the University of California, Berkeley. Its system called Spark has been able to sort 100 terabytes of data, or one trillion records, in a record 23 minutes.17
Conclusion
Big data is here to stay. It is opening up new opportunities, advancing new methods as well as resurrecting some of old approaches such as data visualisation, and creating a brand new infrastructure to store and process large amounts of unstructured data in near real time. In the end, the value of big data will come from generating new and powerful insights or from disconfirming some of our strongly held ideas. As Mark Twain said, “It ain’t what you don’t know that gets you into trouble. It’s what you know for sure that just ain’t so.”
About the Author
Sunil Gupta is the Edward W. Carter Professor of Business Administration and Chair of the General Management Program at Harvard Business School. He is also the co-chair of the executive program on Driving Digital and Social Strategy. In the recent past, he has taught an elective course on Digital Marketing Strategy to MBA students and Advanced Management Program to senior managers.
References
1. Jeremy Ginsberg, Matthew H. Mohebbi, Rajan S. Patel, Lynnette Brammer, Mark S. Smolinski & Larry Bril, “Detecting influenza epidemics using search engine query data,” Nature, 457, Nov 2008, 1012-1014.
2. David Lazer, Ryna Kennedy, Gary King, Alessandro Vespignani, “The Parable of Google Flu: Traps in Big Data Analysis,” Science, 343, March 14, 2014, 1203-1205.
3. Tim Hardord, “Big data: are we making a big mistake,” Financial Times, March 28, 2014.
4. Gary Marcus and Ernest Davis, “Eight (no, Nine!) Problems with Big Data,” The New York Times, April 6, 2014.
5. Glen Urban, Gui Liberali, Erin MacDonald, Robert Bordley, and John Hauser, “Morphing Banner Advertising,” Marketing Science, 33, 1 (Jan-Feb), 2014, 27-46.
6. “UPS: Putting Analytics in the Driver’s Seat,” Digital Transformation Review, CapGemini, January 2014.
7. James Cooke, “Kimberly-Clark connects its supply chain to the store shelf,” Supply Chain Quarterly, Quarter 1, 2103.
8. Karim Lakhani, Marco Iansiti, and Kerry Herman, “GE and the Industrial Internet,” HBS Case, 614-032, June 2014.
9. http://www.unglobalpulse.org/research
10. Sunil Gupta, Rajiv Lal, and Natalie Kindred, “MasterCard: Driving Financial Inclusion,” HBS Case # 515-035, October 2014.
11. Thomas Davenport, Marco Iansiti, and Alain Sereis, “Competing with Analytics at Procter & Gamble,” HBS Case # 613-045, April 2013.
12. Paul Krugman, “How Complicated Does the Model Have to be?” Oxford Review of Economic Policy, vol. 16, no. 4, 2000.
13. Michael Banko and Eric Brill, “Scaling a Very Very Large Corpora for Natural Language Disambiguation,” Microsoft Research Paper, 2001.
14. Eliot van Buskirk, “How the Netflix Prize was Won,” Wired, September 22, 2009.
15. Ibid.
16. Salganik, Matthew J., Peter S. Doods, and Duncan J. Watts, “Experimental Study of the Inequality and Unpredictability in an Artificial Cultural Market,” Science, Feb 10, 2006, 854-856.
17. https://databricks.com/blog/2014/10/10/spark-petabyte-sort.html
[/ms-protect-content]


